 13
13peptides
spectra
0.000 | 0.000
0.162 | 0.192
0.650 | 0.688
0.137 | 0.162
0.000 | 0.000
0.000 | 0.000
0.000 | 0.000
0.000 | 0.000
| Plot | Mito | Lyso | Perox | ER | Golgi | PM | Cytosol | Nucleus | |||||
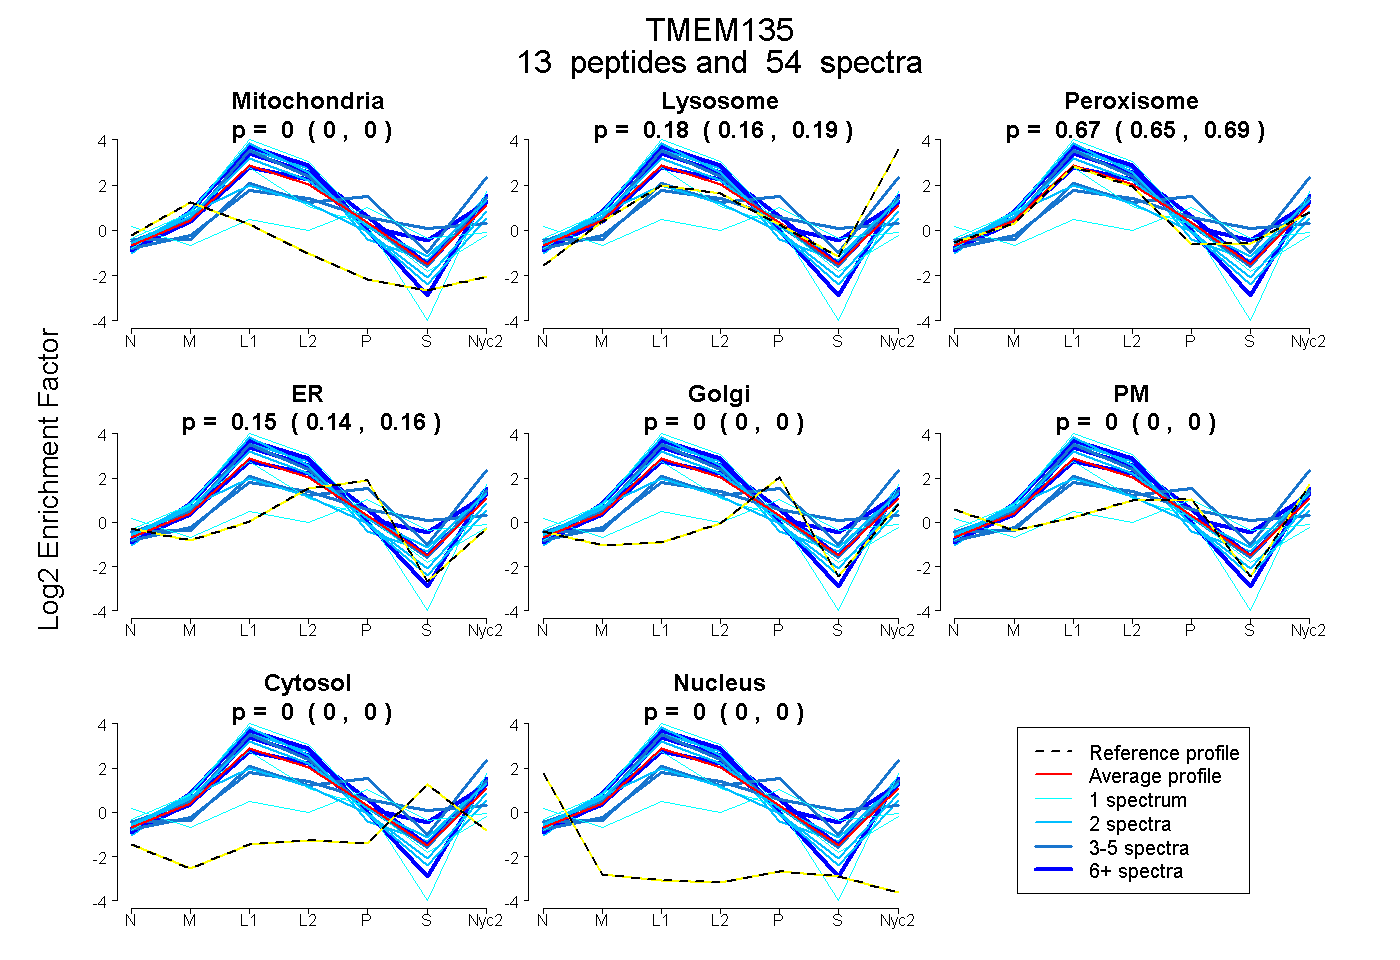
| Expt A |
13 peptides |
54 spectra |
|
0.000 0.000 | 0.000 |
0.178 0.162 | 0.192 |
0.671 0.650 | 0.688 |
0.150 0.137 | 0.162 |
0.000 0.000 | 0.000 |
0.000 0.000 | 0.000 |
0.000 0.000 | 0.000 |
0.000 0.000 | 0.000 |
| 1 spectrum, MFSVGYLIQCCLR | 0.000 | 0.000 | 0.332 | 0.049 | 0.390 | 0.000 | 0.210 | 0.020 | ||
| 1 spectrum, HYEDNCISYCIK | 0.167 | 0.000 | 0.638 | 0.195 | 0.000 | 0.000 | 0.000 | 0.000 | ||
| 7 spectra, EFHNFIPR | 0.000 | 0.217 | 0.690 | 0.093 | 0.000 | 0.000 | 0.000 | 0.000 | ||
| 2 spectra, GTSCFLR | 0.000 | 0.000 | 0.925 | 0.075 | 0.000 | 0.000 | 0.000 | 0.000 | ||
| 11 spectra, FALMNR | 0.000 | 0.197 | 0.776 | 0.027 | 0.000 | 0.000 | 0.000 | 0.000 | ||
| 2 spectra, STTISMYLASK | 0.000 | 0.199 | 0.773 | 0.028 | 0.000 | 0.000 | 0.000 | 0.000 | ||
| 2 spectra, SLVDSICK | 0.205 | 0.278 | 0.327 | 0.148 | 0.000 | 0.042 | 0.000 | 0.000 | ||
| 4 spectra, GFTFSALR | 0.000 | 0.213 | 0.757 | 0.029 | 0.000 | 0.000 | 0.000 | 0.000 | ||
| 4 spectra, HLFTEPSR | 0.000 | 0.020 | 0.643 | 0.182 | 0.000 | 0.000 | 0.154 | 0.000 | ||
| 2 spectra, ALDVFGTGASR | 0.000 | 0.226 | 0.774 | 0.000 | 0.000 | 0.000 | 0.000 | 0.000 | ||
| 3 spectra, GIEAGK | 0.000 | 0.483 | 0.193 | 0.046 | 0.156 | 0.121 | 0.000 | 0.000 | ||
| 1 spectrum, IPSAFR | 0.000 | 0.366 | 0.494 | 0.140 | 0.000 | 0.000 | 0.000 | 0.000 | ||
| 14 spectra, AMSLIALVR | 0.000 | 0.294 | 0.646 | 0.060 | 0.000 | 0.000 | 0.000 | 0.000 |
| Plot | Mito | Lyso or Perox | ER | Golgi | PM | Cytosol | Nucleus | ||||||
| Expt B |
9 peptides |
31 spectra |
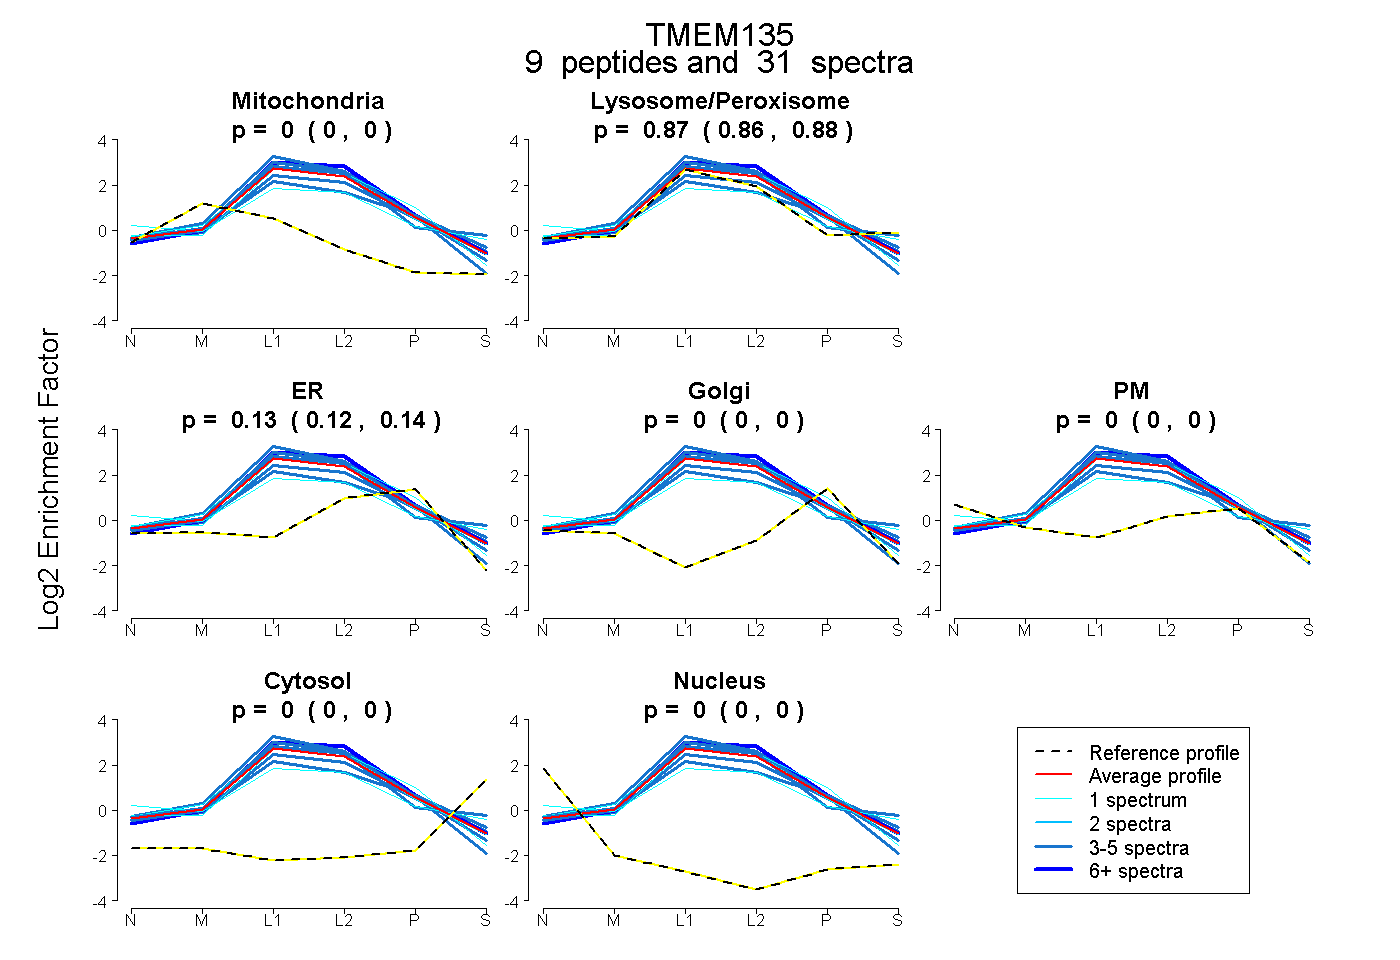 |
0.000 0.000 | 0.000 |
0.868 0.857 | 0.878 |
0.132 0.120 | 0.141 |
0.000 0.000 | 0.000 |
0.000 0.000 | 0.000 |
0.000 0.000 | 0.000 |
0.000 0.000 | 0.000 |
|||
| Plot | Lyso | Other | |||||||||||
| Expt C |
20 peptides |
243 spectra |
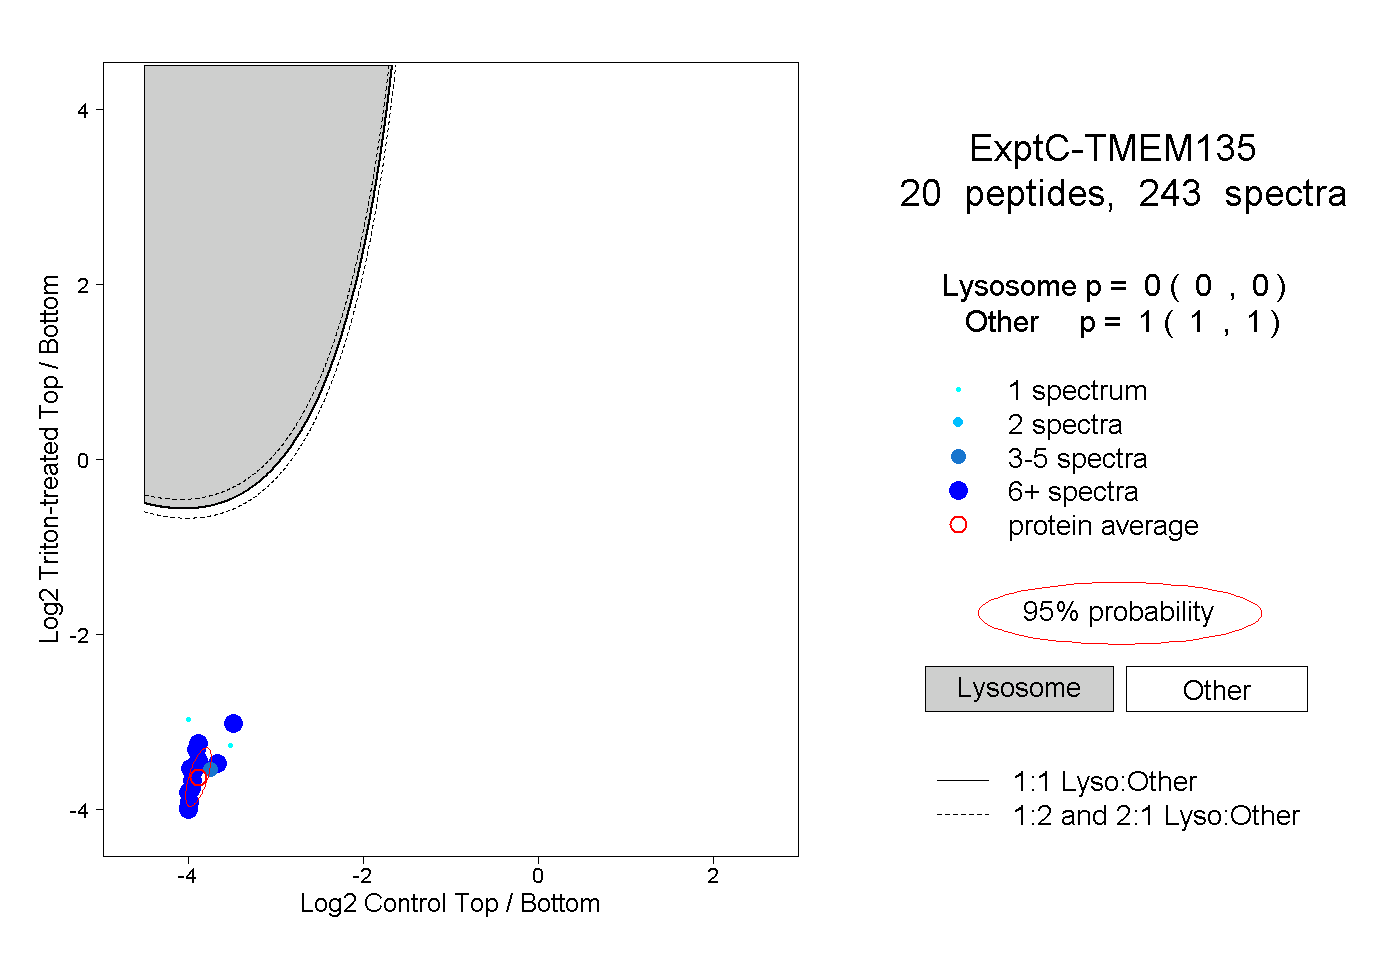 |
0.000 0.000 | 0.000 |
1.000 1.000 | 1.000 |
||||||||
| Plot | Lyso | Other | |||||||||||
| Expt D |
9 peptides |
31 spectra |
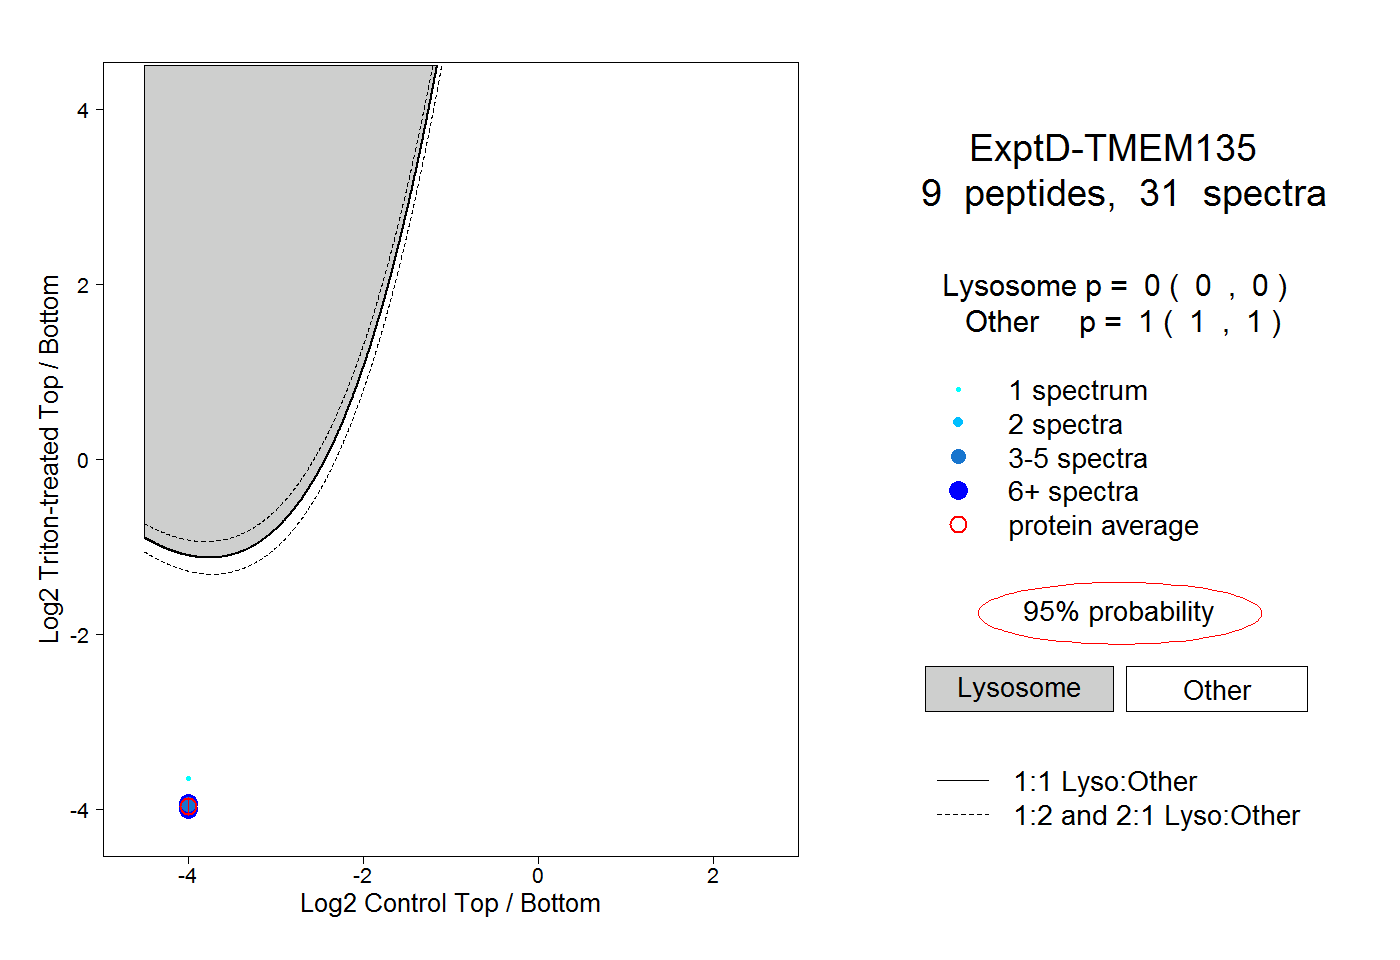 |
0.000 0.000 | 0.000 |
1.000 1.000 | 1.000 |