 2
2peptides
spectra
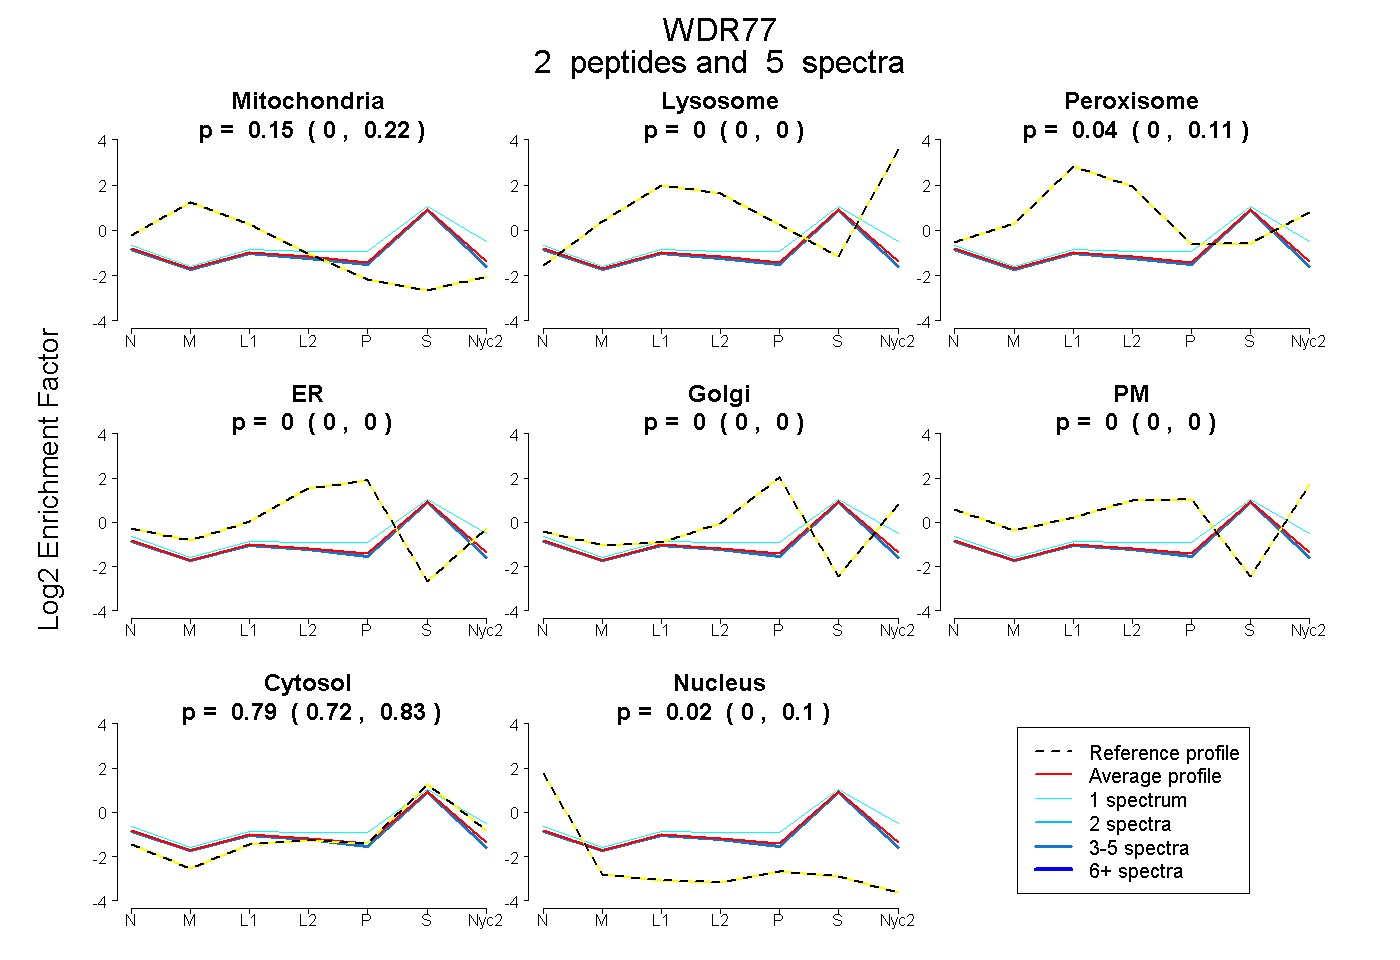
0.000 | 0.221
0.000 | 0.000
0.000 | 0.115
0.000 | 0.000
0.000 | 0.000
0.000 | 0.000
0.724 | 0.835
0.000 | 0.103
| Plot | Mito | Lyso | Perox | ER | Golgi | PM | Cytosol | Nucleus | |||||
| Expt A |
2 peptides |
5 spectra |
|
0.147 0.000 | 0.221 |
0.000 0.000 | 0.000 |
0.035 0.000 | 0.115 |
0.000 0.000 | 0.000 |
0.000 0.000 | 0.000 |
0.000 0.000 | 0.000 |
0.793 0.724 | 0.835 |
0.025 0.000 | 0.103 |
| 4 spectra, ETVFLSCSEDSR | 0.178 | 0.000 | 0.000 | 0.000 | 0.000 | 0.000 | 0.798 | 0.024 | ||
| 1 spectrum, ESPPPLVPPAAR | 0.028 | 0.000 | 0.097 | 0.000 | 0.000 | 0.094 | 0.780 | 0.000 |
| Plot | Lyso | Other | |||||||||||
| Expt C |
3 peptides |
12 spectra |
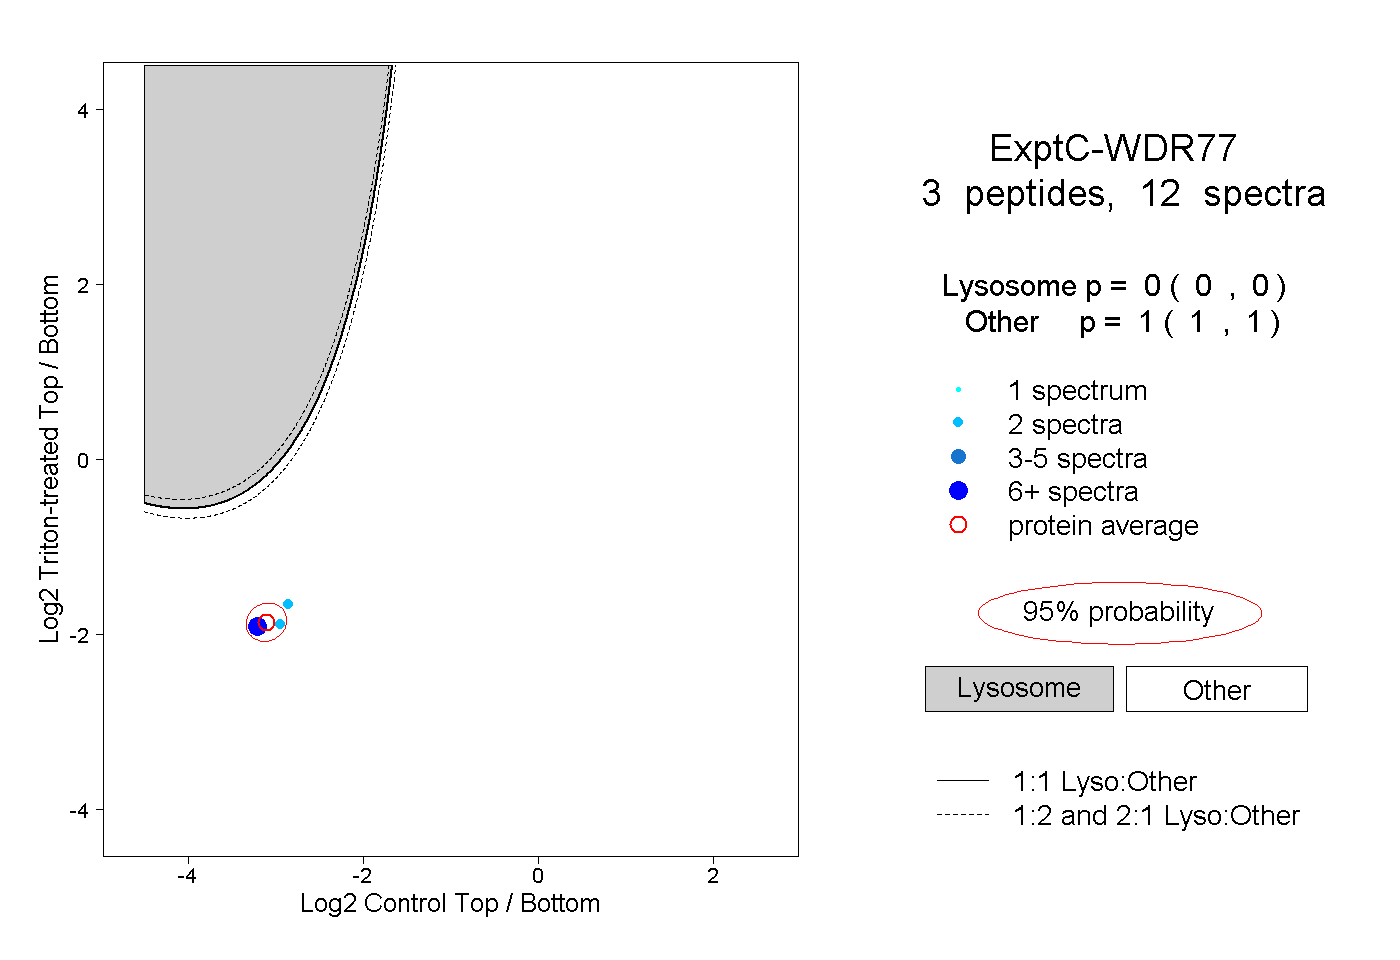 |
0.000 0.000 | 0.000 |
1.000 1.000 | 1.000 |