 5
5peptides
spectra
0.000 | 0.000
0.000 | 0.000
0.112 | 0.172
0.395 | 0.524
0.123 | 0.241
0.000 | 0.000
0.170 | 0.231
0.000 | 0.000
1peptide
spectrum
NA | NA
NA | NA
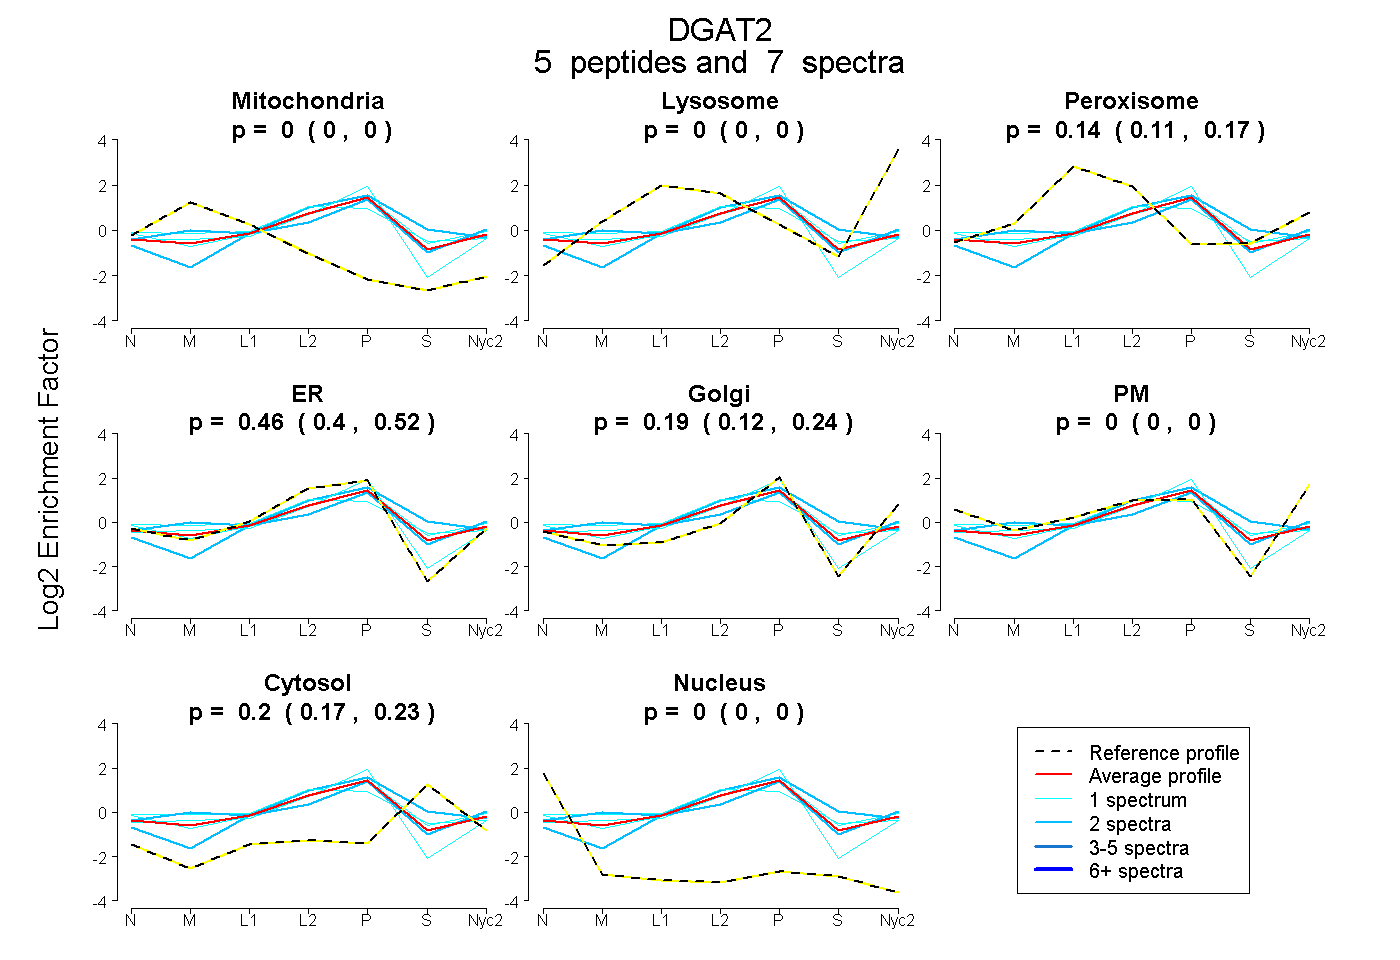
| Plot | Mito | Lyso | Perox | ER | Golgi | PM | Cytosol | Nucleus | |||||
| Expt A |
5 peptides |
7 spectra |
|
0.000 0.000 | 0.000 |
0.000 0.000 | 0.000 |
0.145 0.112 | 0.172 |
0.463 0.395 | 0.524 |
0.188 0.123 | 0.241 |
0.000 0.000 | 0.000 |
0.204 0.170 | 0.231 |
0.000 0.000 | 0.000 |
||
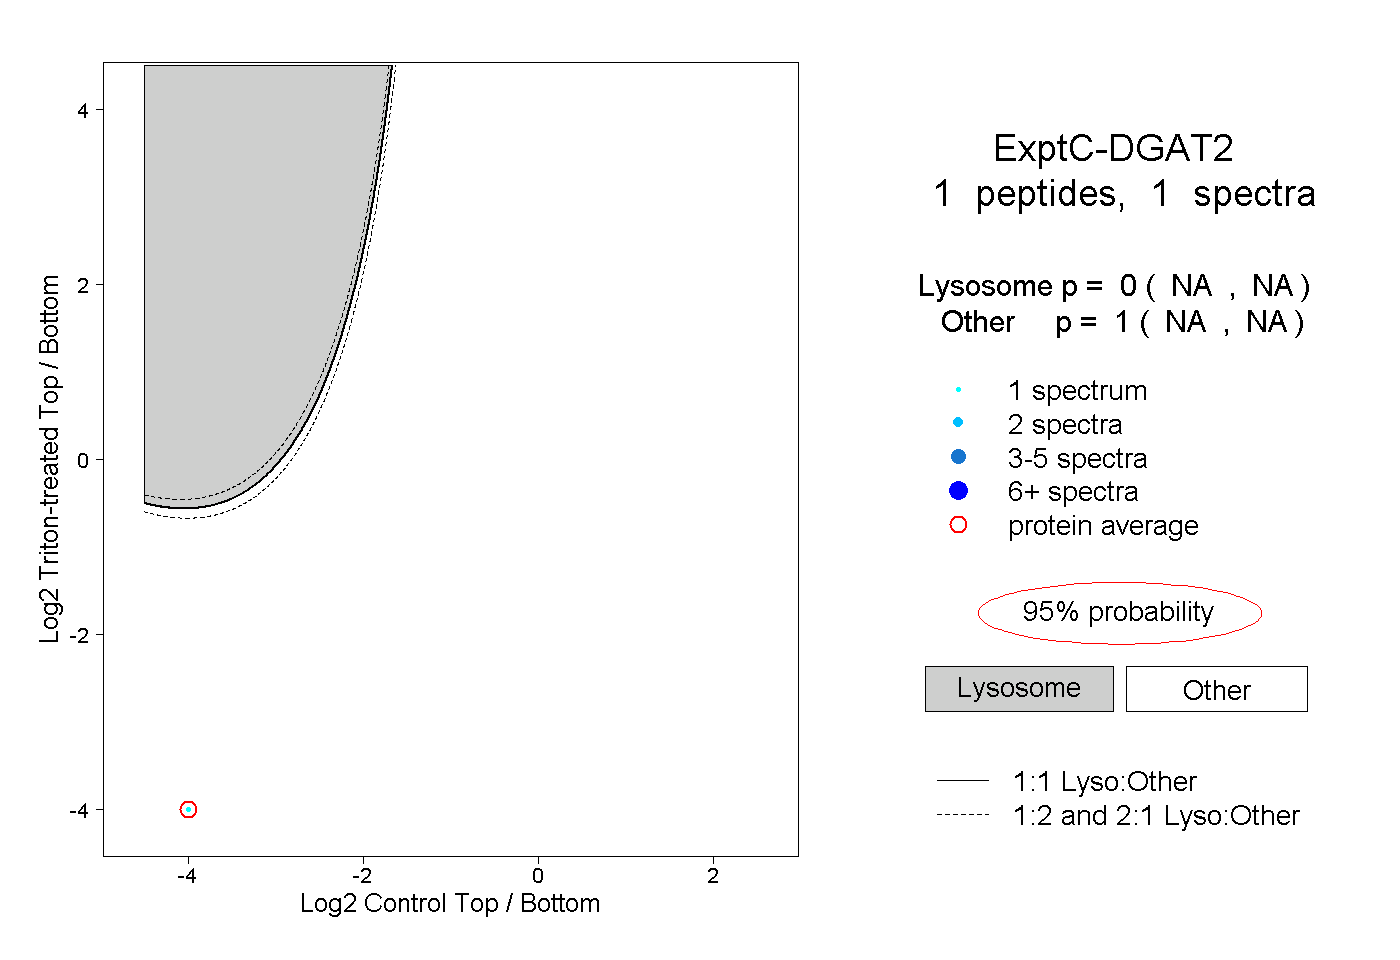
| Plot | Lyso | Other | |||||||||||
| Expt C |
1 peptide |
1 spectrum |
|
0.000 NA | NA |
1.000 NA | NA |