 13
13peptides
spectra
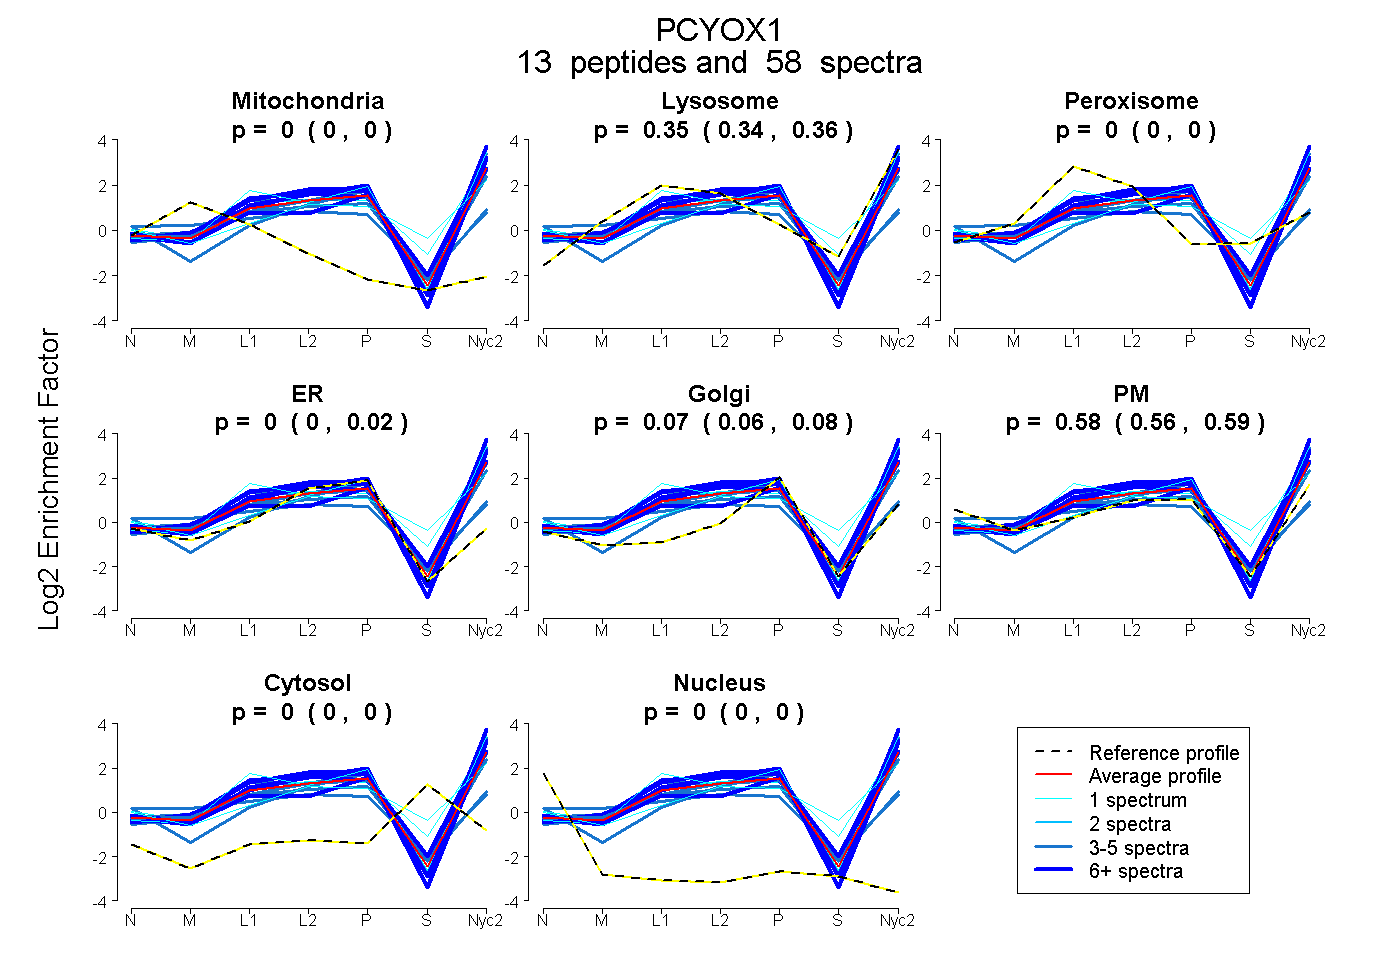
0.000 | 0.000
0.340 | 0.360
0.000 | 0.000
0.000 | 0.018
0.056 | 0.081
0.560 | 0.590
0.000 | 0.000
0.000 | 0.000
8peptides
spectra
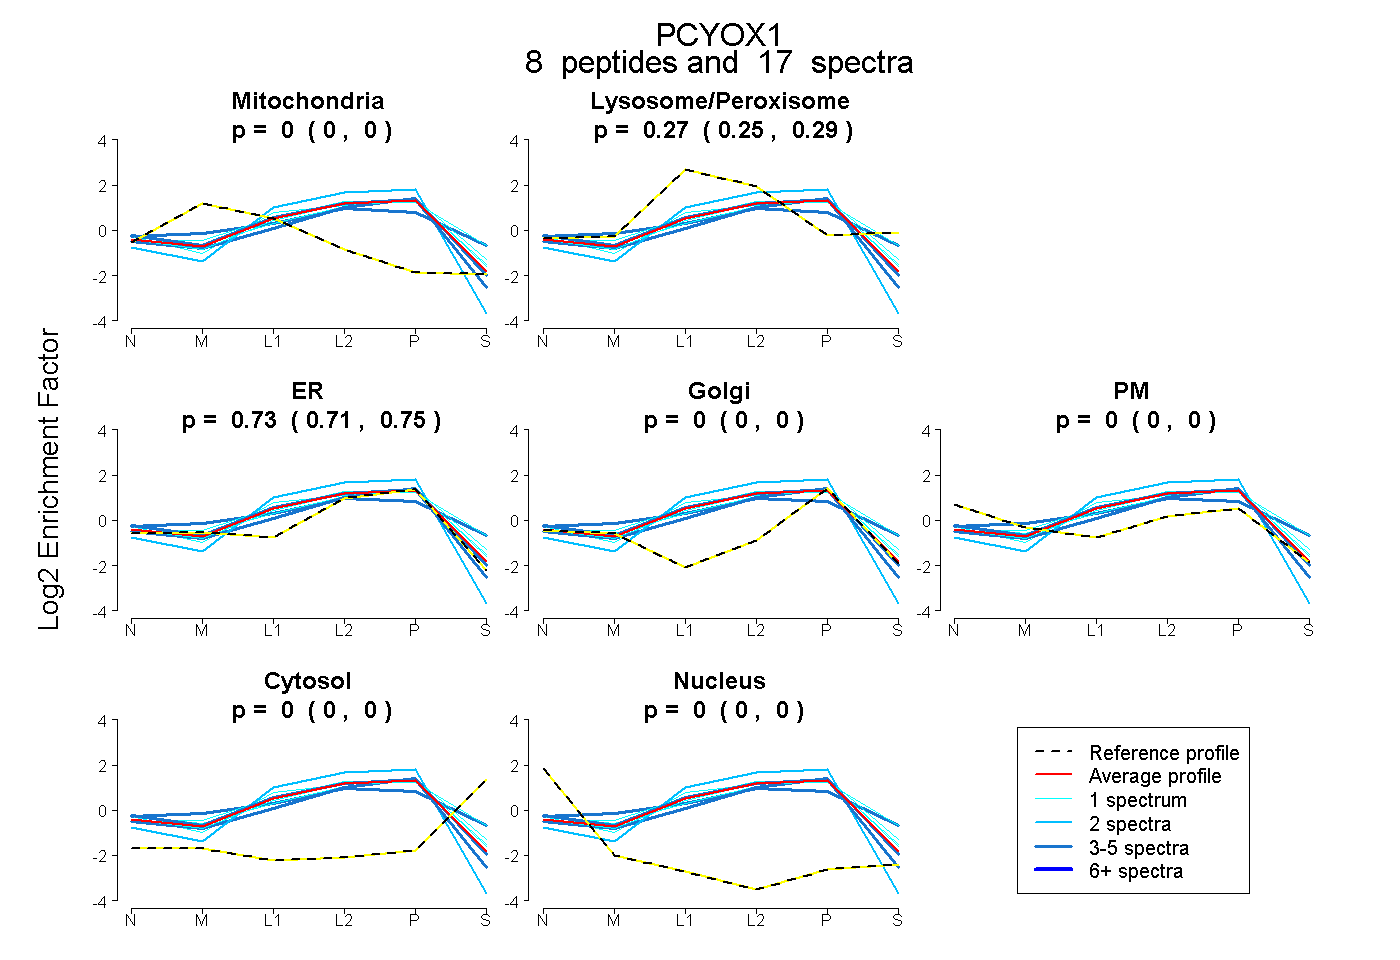
0.000 | 0.000
0.251 | 0.289
0.707 | 0.746
0.000 | 0.000
0.000 | 0.000
0.000 | 0.000
0.000 | 0.000
14peptides
spectra
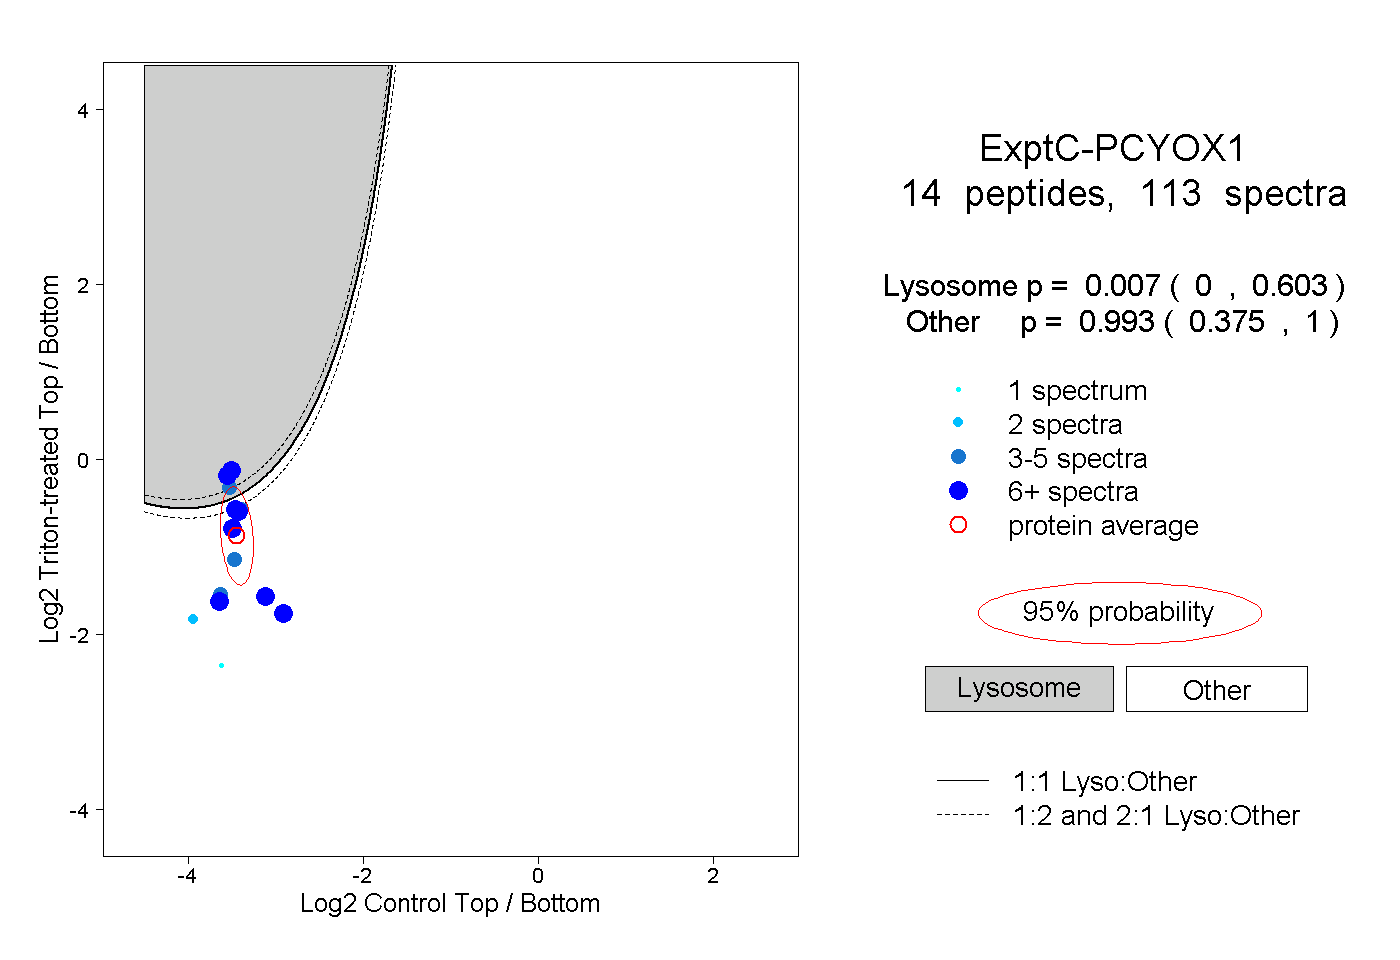
0.000 | 0.603
0.375 | 1.000
7peptides
spectra
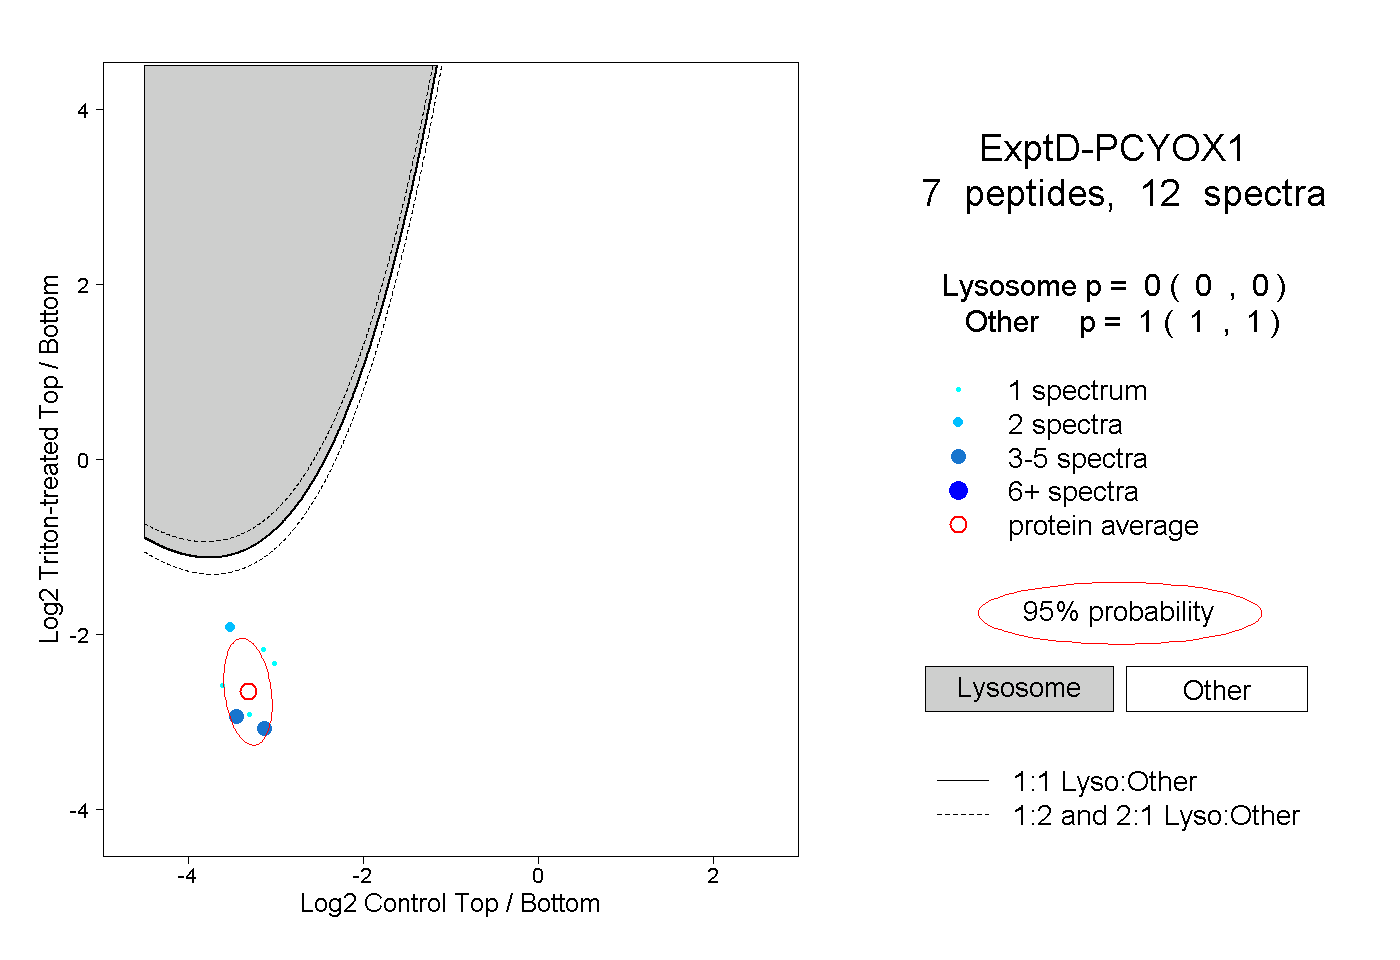
0.000 | 0.000
1.000 | 1.000