 13
13peptides
spectra
0.000 | 0.000
0.340 | 0.360
0.000 | 0.000
0.000 | 0.018
0.056 | 0.081
0.560 | 0.590
0.000 | 0.000
0.000 | 0.000
| Plot | Mito | Lyso | Perox | ER | Golgi | PM | Cytosol | Nucleus | |||||
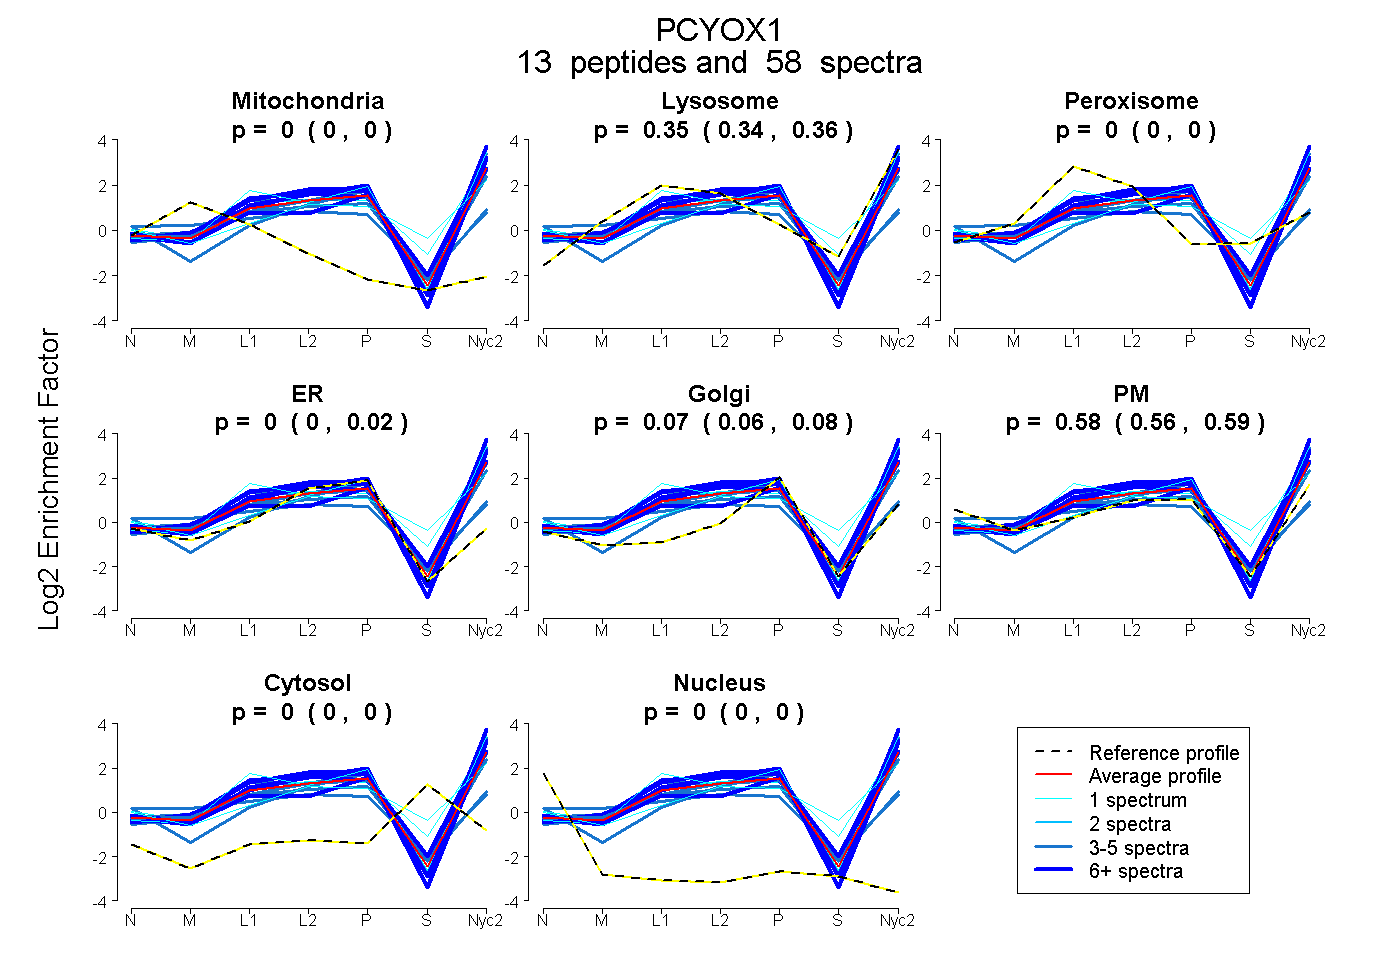
| Expt A |
13 peptides |
58 spectra |
|
0.000 0.000 | 0.000 |
0.351 0.340 | 0.360 |
0.000 0.000 | 0.000 |
0.000 0.000 | 0.018 |
0.072 0.056 | 0.081 |
0.578 0.560 | 0.590 |
0.000 0.000 | 0.000 |
0.000 0.000 | 0.000 |
| 1 spectrum, VQGHDYEAGGSVIHPLNLHMK | 0.000 | 0.491 | 0.000 | 0.000 | 0.010 | 0.500 | 0.000 | 0.000 | ||
| 4 spectra, CPSIILHDR | 0.120 | 0.000 | 0.198 | 0.056 | 0.131 | 0.496 | 0.000 | 0.000 | ||
| 6 spectra, LMYAIGGDDYVR | 0.000 | 0.509 | 0.000 | 0.000 | 0.000 | 0.491 | 0.000 | 0.000 | ||
| 1 spectrum, ELGLSSVPASGGLVGVYNGK | 0.000 | 0.492 | 0.000 | 0.000 | 0.000 | 0.508 | 0.000 | 0.000 | ||
| 10 spectra, IDVFER | 0.000 | 0.465 | 0.000 | 0.000 | 0.000 | 0.535 | 0.000 | 0.000 | ||
| 3 spectra, AGFSETFLNEMIAPVMK | 0.000 | 0.492 | 0.000 | 0.000 | 0.066 | 0.442 | 0.000 | 0.000 | ||
| 6 spectra, LFLSYDYAVR | 0.000 | 0.310 | 0.000 | 0.020 | 0.000 | 0.670 | 0.000 | 0.000 | ||
| 4 spectra, IAIVGAGIGGTSSAYYLR | 0.000 | 0.331 | 0.000 | 0.000 | 0.104 | 0.565 | 0.000 | 0.000 | ||
| 9 spectra, YGFQSLR | 0.000 | 0.356 | 0.000 | 0.000 | 0.228 | 0.415 | 0.000 | 0.000 | ||
| 7 spectra, MHMWVEDLLDK | 0.000 | 0.509 | 0.000 | 0.000 | 0.002 | 0.489 | 0.000 | 0.000 | ||
| 1 spectrum, YQSHDYAFSSVEK | 0.000 | 0.344 | 0.000 | 0.000 | 0.000 | 0.483 | 0.172 | 0.000 | ||
| 3 spectra, MYEVVYK | 0.000 | 0.388 | 0.000 | 0.000 | 0.118 | 0.494 | 0.000 | 0.000 | ||
| 3 spectra, EGPPPAVDGMHVWK | 0.000 | 0.019 | 0.000 | 0.412 | 0.132 | 0.409 | 0.028 | 0.000 |
| Plot | Mito | Lyso or Perox | ER | Golgi | PM | Cytosol | Nucleus | ||||||
| Expt B |
8 peptides |
17 spectra |
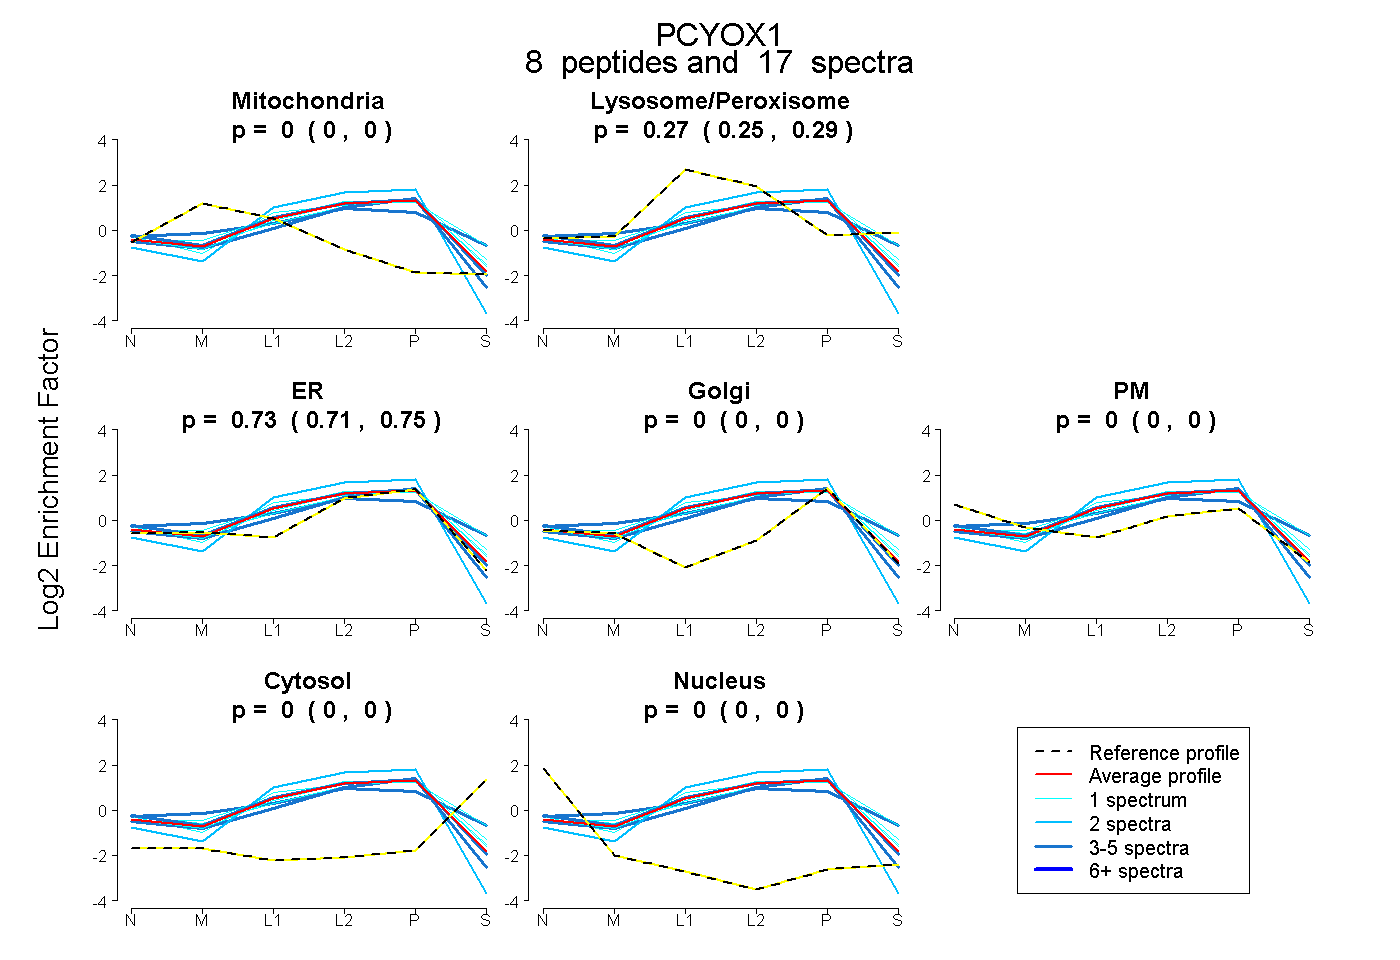 |
0.000 0.000 | 0.000 |
0.271 0.251 | 0.289 |
0.729 0.707 | 0.746 |
0.000 0.000 | 0.000 |
0.000 0.000 | 0.000 |
0.000 0.000 | 0.000 |
0.000 0.000 | 0.000 |
|||
| Plot | Lyso | Other | |||||||||||
| Expt C |
14 peptides |
113 spectra |
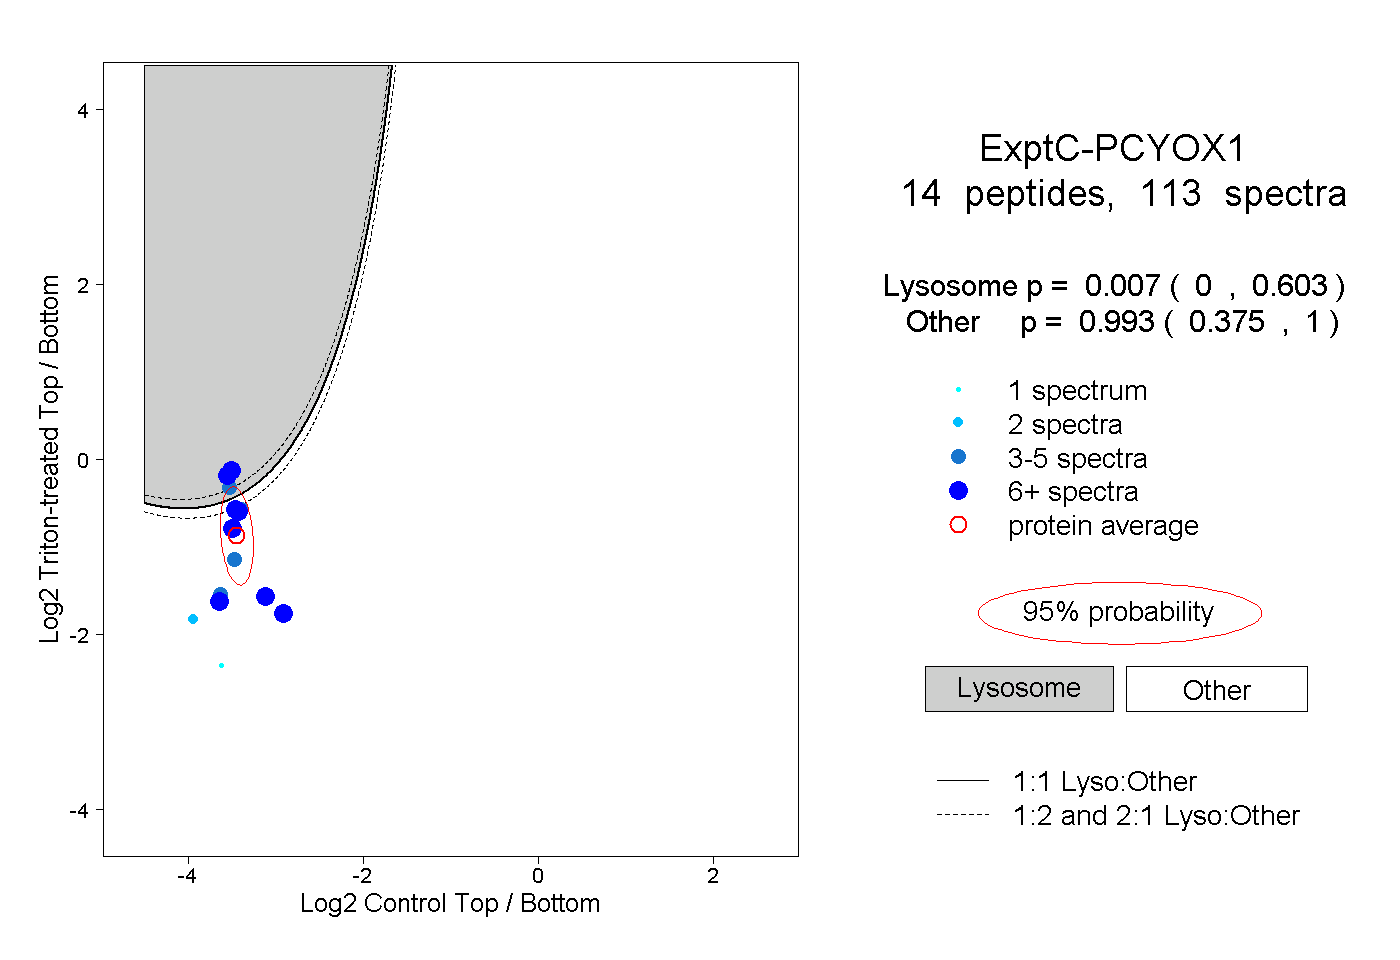 |
0.007 0.000 | 0.603 |
0.993 0.375 | 1.000 |
||||||||
| Plot | Lyso | Other | |||||||||||
| Expt D |
7 peptides |
12 spectra |
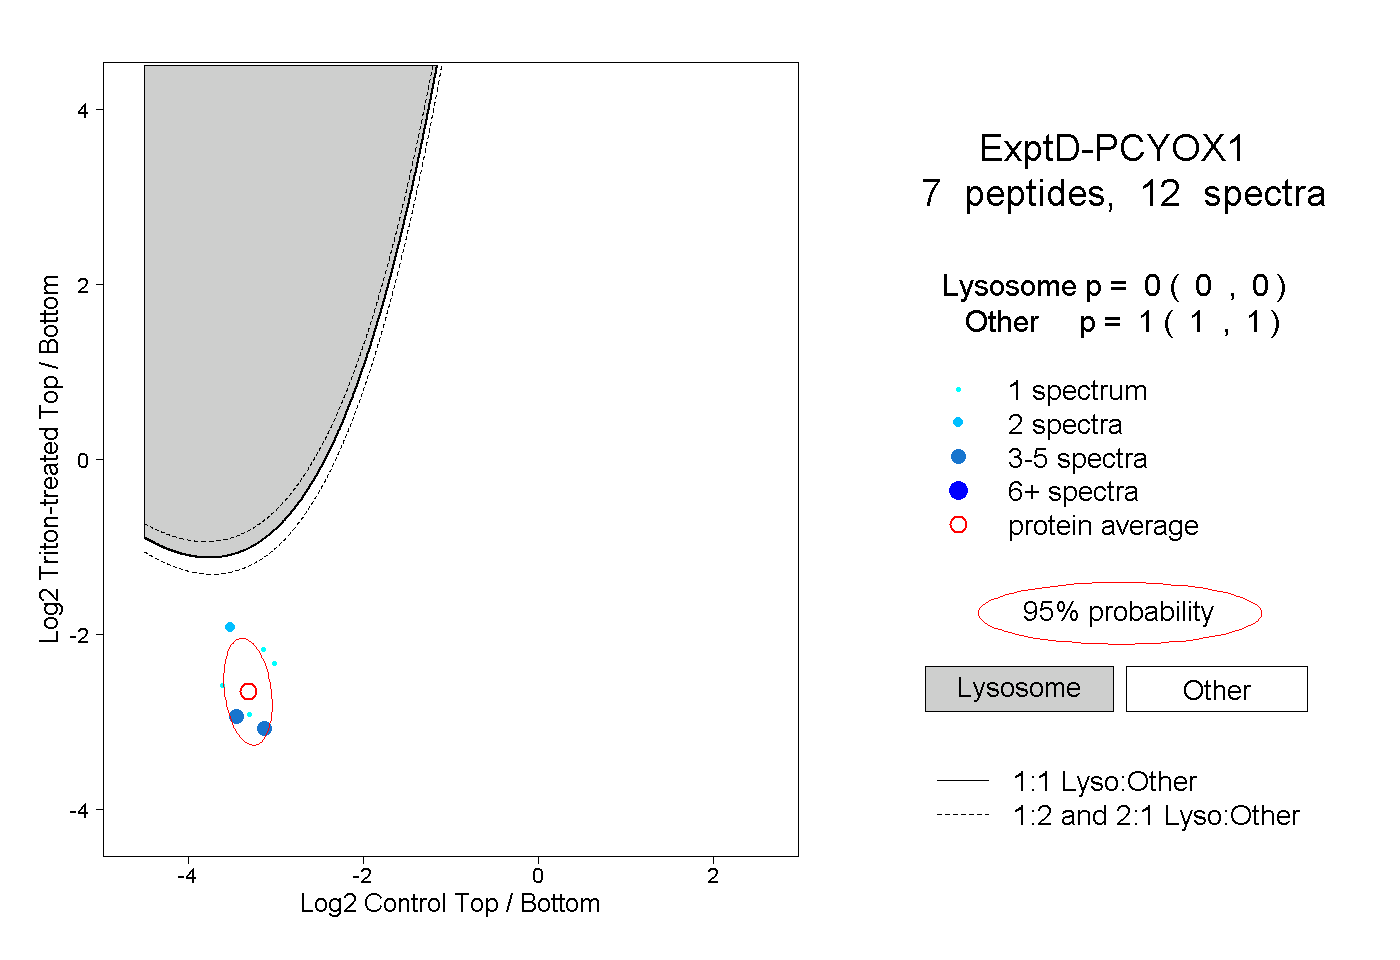 |
0.000 0.000 | 0.000 |
1.000 1.000 | 1.000 |