 6
6peptides
spectra
0.739 | 0.749
0.000 | 0.000
0.000 | 0.000
0.153 | 0.176
0.000 | 0.000
0.077 | 0.101
0.000 | 0.000
0.000 | 0.000
| Plot | Mito | Lyso | Perox | ER | Golgi | PM | Cytosol | Nucleus | |||||
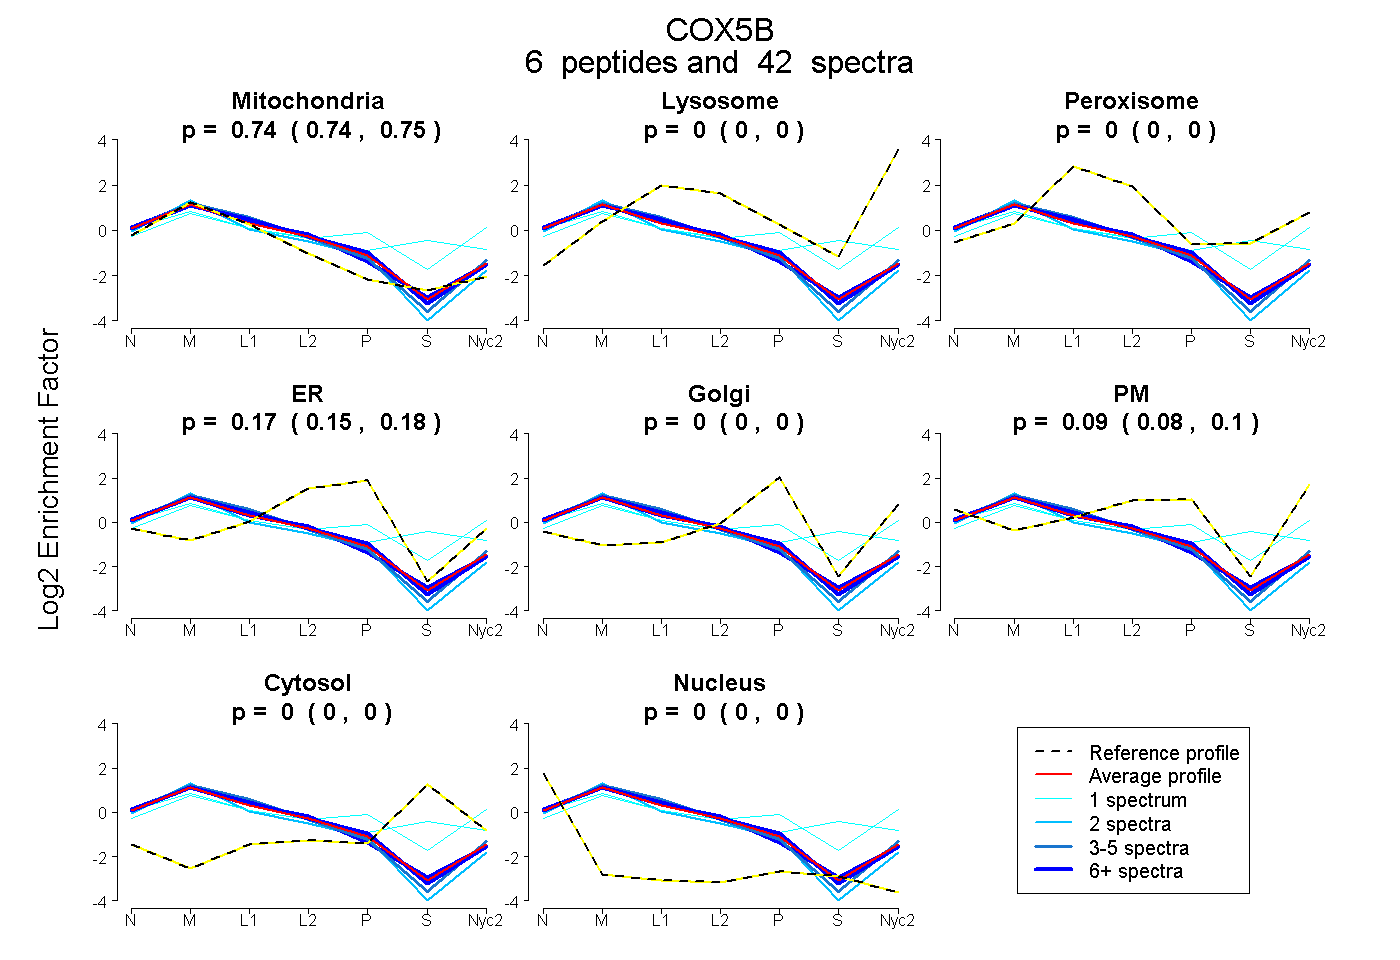
| Expt A |
6 peptides |
42 spectra |
|
0.744 0.739 | 0.749 |
0.000 0.000 | 0.000 |
0.000 0.000 | 0.000 |
0.166 0.153 | 0.176 |
0.000 0.000 | 0.000 |
0.090 0.077 | 0.101 |
0.000 0.000 | 0.000 |
0.000 0.000 | 0.000 |
| 3 spectra, GLDPYNMLPPK | 0.760 | 0.000 | 0.000 | 0.085 | 0.000 | 0.155 | 0.000 | 0.000 | ||
| 2 spectra, CPNCGTHYK | 0.808 | 0.000 | 0.000 | 0.192 | 0.000 | 0.000 | 0.000 | 0.000 | ||
| 17 spectra, EIMIAAQR | 0.777 | 0.000 | 0.000 | 0.123 | 0.000 | 0.100 | 0.000 | 0.000 | ||
| 18 spectra, LVPYQMVH | 0.735 | 0.000 | 0.000 | 0.209 | 0.000 | 0.055 | 0.000 | 0.000 | ||
| 1 spectrum, AASGTK | 0.434 | 0.104 | 0.000 | 0.000 | 0.134 | 0.287 | 0.041 | 0.000 | ||
| 1 spectrum, EDPNLVPSVSNK | 0.424 | 0.000 | 0.245 | 0.000 | 0.042 | 0.036 | 0.253 | 0.000 |
| Plot | Mito | Lyso or Perox | ER | Golgi | PM | Cytosol | Nucleus | ||||||
| Expt B |
4 peptides |
26 spectra |
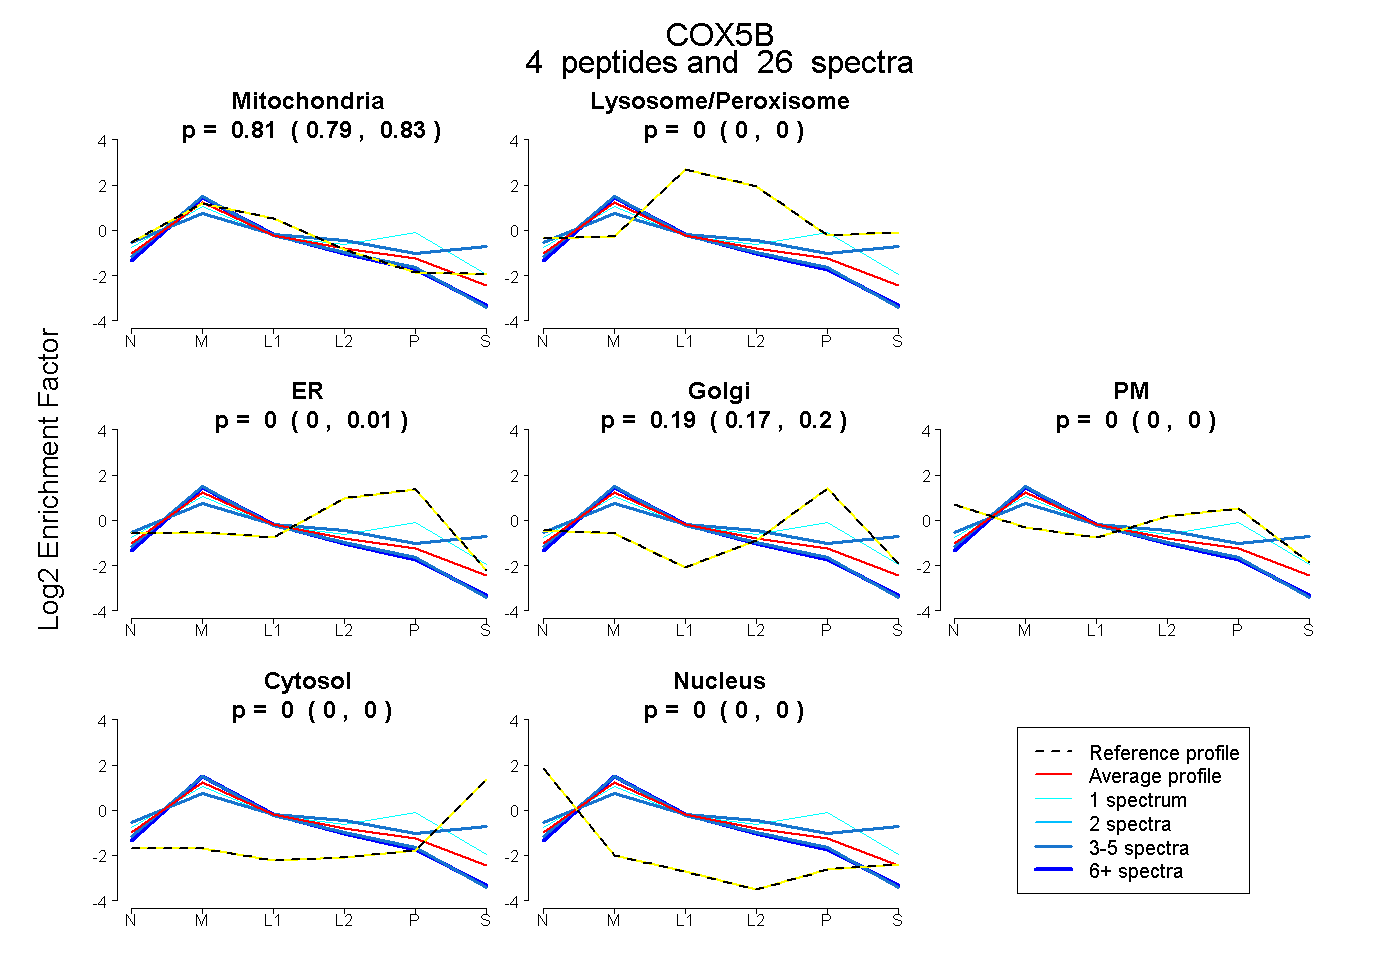 |
0.811 0.789 | 0.828 |
0.000 0.000 | 0.000 |
0.000 0.000 | 0.013 |
0.189 0.166 | 0.204 |
0.000 0.000 | 0.000 |
0.000 0.000 | 0.000 |
0.000 0.000 | 0.000 |
|||
| Plot | Lyso | Other | |||||||||||
| Expt C |
6 peptides |
247 spectra |
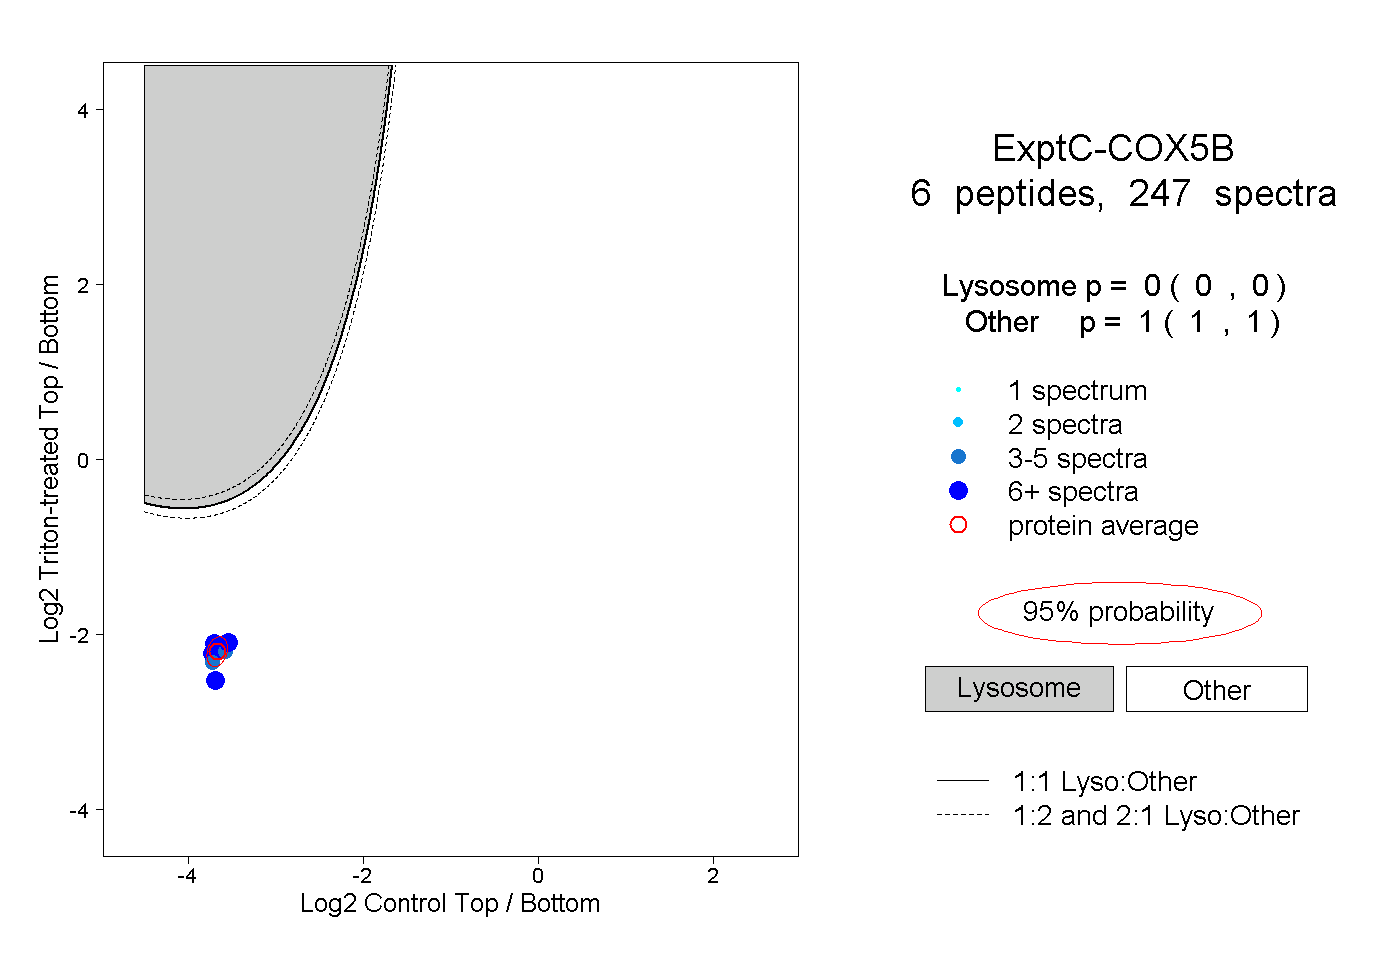 |
0.000 0.000 | 0.000 |
1.000 1.000 | 1.000 |
||||||||
| Plot | Lyso | Other | |||||||||||
| Expt D |
2 peptides |
5 spectra |
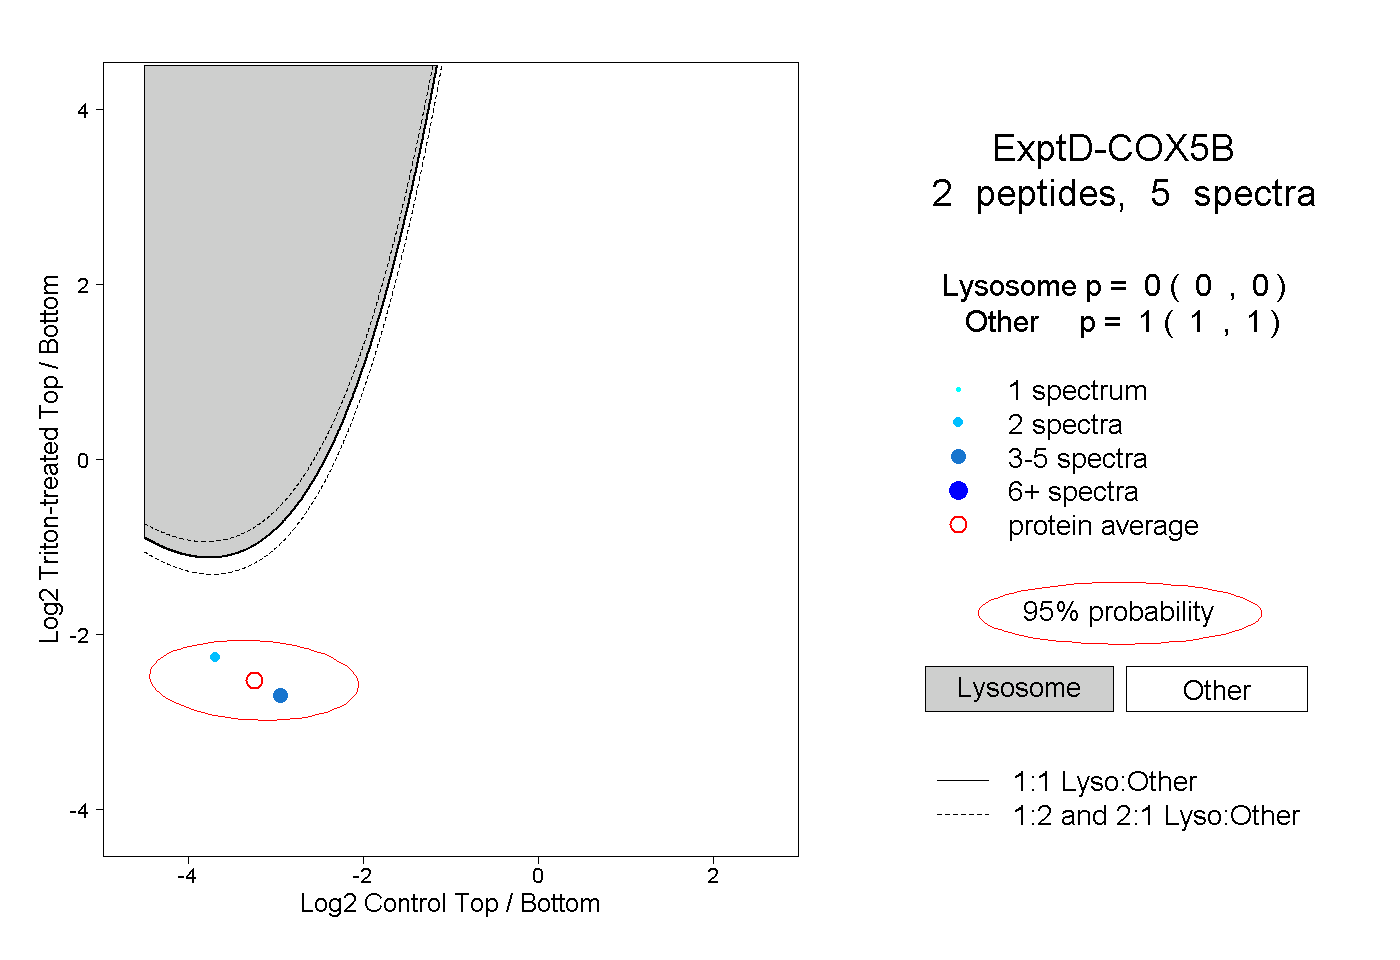 |
0.000 0.000 | 0.000 |
1.000 1.000 | 1.000 |