 4
4peptides
spectra
0.000 | 0.050
0.000 | 0.195
0.000 | 0.144
0.000 | 0.000
0.000 | 0.129
0.000 | 0.113
0.688 | 0.785
0.000 | 0.000
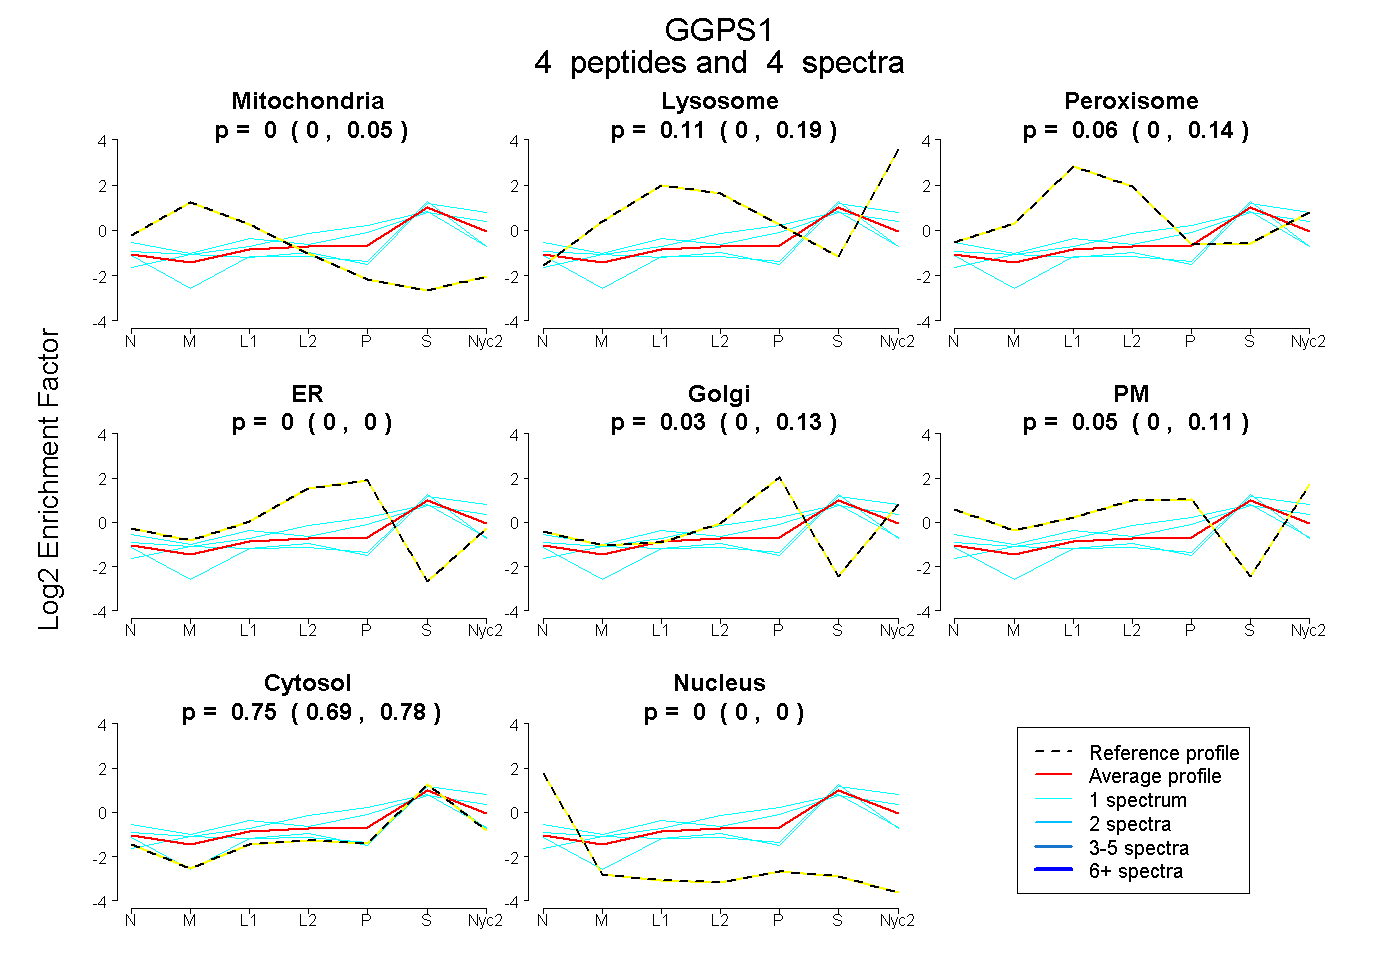
| Plot | Mito | Lyso | Perox | ER | Golgi | PM | Cytosol | Nucleus | |||||
| Expt A |
4 peptides |
4 spectra |
|
0.000 0.000 | 0.050 |
0.110 0.000 | 0.195 |
0.058 0.000 | 0.144 |
0.000 0.000 | 0.000 |
0.030 0.000 | 0.129 |
0.051 0.000 | 0.113 |
0.750 0.688 | 0.785 |
0.000 0.000 | 0.000 |
| 1 spectrum, VLTLDHPDAVK | 0.000 | 0.233 | 0.000 | 0.000 | 0.000 | 0.000 | 0.767 | 0.000 | ||
| 1 spectrum, SFCEDLTEGK | 0.000 | 0.000 | 0.048 | 0.000 | 0.000 | 0.000 | 0.946 | 0.006 | ||
| 1 spectrum, EYSENK | 0.000 | 0.105 | 0.096 | 0.000 | 0.051 | 0.160 | 0.588 | 0.000 | ||
| 1 spectrum, DTYTCPTEEEYK | 0.000 | 0.000 | 0.119 | 0.259 | 0.001 | 0.000 | 0.621 | 0.000 |