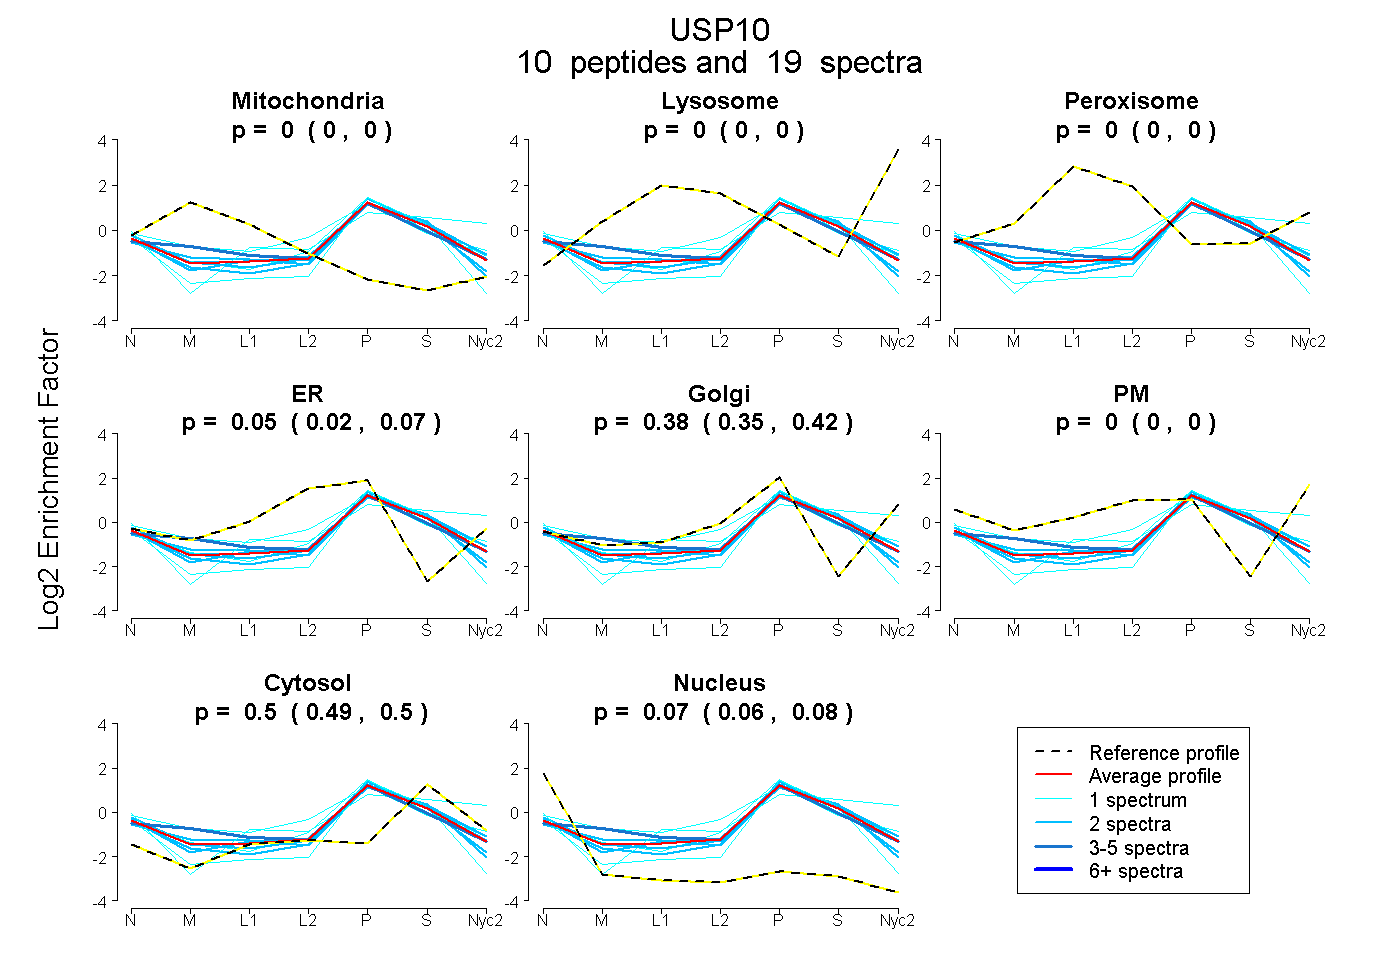
 10
10peptides
spectra
0.000 | 0.000
0.000 | 0.000
0.000 | 0.000
0.019 | 0.074
0.349 | 0.415
0.000 | 0.000
0.491 | 0.503
0.060 | 0.075
| Plot | Mito | Lyso | Perox | ER | Golgi | PM | Cytosol | Nucleus | |||||
| Expt A |
10 peptides |
19 spectra |
|
0.000 0.000 | 0.000 |
0.000 0.000 | 0.000 |
0.000 0.000 | 0.000 |
0.050 0.019 | 0.074 |
0.385 0.349 | 0.415 |
0.000 0.000 | 0.000 |
0.497 0.491 | 0.503 |
0.069 0.060 | 0.075 |
| 1 spectrum, SSLSEK | 0.044 | 0.000 | 0.000 | 0.327 | 0.218 | 0.000 | 0.411 | 0.000 | ||
| 1 spectrum, TGGCQK | 0.000 | 0.000 | 0.000 | 0.018 | 0.487 | 0.000 | 0.443 | 0.053 | ||
| 1 spectrum, QADFVQTPITGIFGGHIR | 0.000 | 0.000 | 0.000 | 0.000 | 0.340 | 0.074 | 0.586 | 0.000 | ||
| 5 spectra, VQRPCTSTPMIDSFVR | 0.103 | 0.000 | 0.000 | 0.021 | 0.427 | 0.000 | 0.437 | 0.012 | ||
| 2 spectra, VINQYQVVRPSADR | 0.000 | 0.000 | 0.000 | 0.000 | 0.449 | 0.000 | 0.496 | 0.055 | ||
| 1 spectrum, SVVYQQSSK | 0.000 | 0.000 | 0.000 | 0.000 | 0.268 | 0.000 | 0.492 | 0.240 | ||
| 2 spectra, EGLVPVSEDPVAIK | 0.000 | 0.000 | 0.000 | 0.208 | 0.128 | 0.000 | 0.548 | 0.116 | ||
| 2 spectra, DIRPGAAFEPTYIYR | 0.000 | 0.000 | 0.000 | 0.000 | 0.435 | 0.000 | 0.532 | 0.033 | ||
| 2 spectra, NIEYPVDLEISR | 0.000 | 0.000 | 0.000 | 0.000 | 0.397 | 0.000 | 0.475 | 0.127 | ||
| 2 spectra, LPPVLVLHLK | 0.000 | 0.000 | 0.000 | 0.068 | 0.376 | 0.000 | 0.483 | 0.074 |
| Plot | Mito | Lyso or Perox | ER | Golgi | PM | Cytosol | Nucleus | ||||||
| Expt B |
4 peptides |
4 spectra |
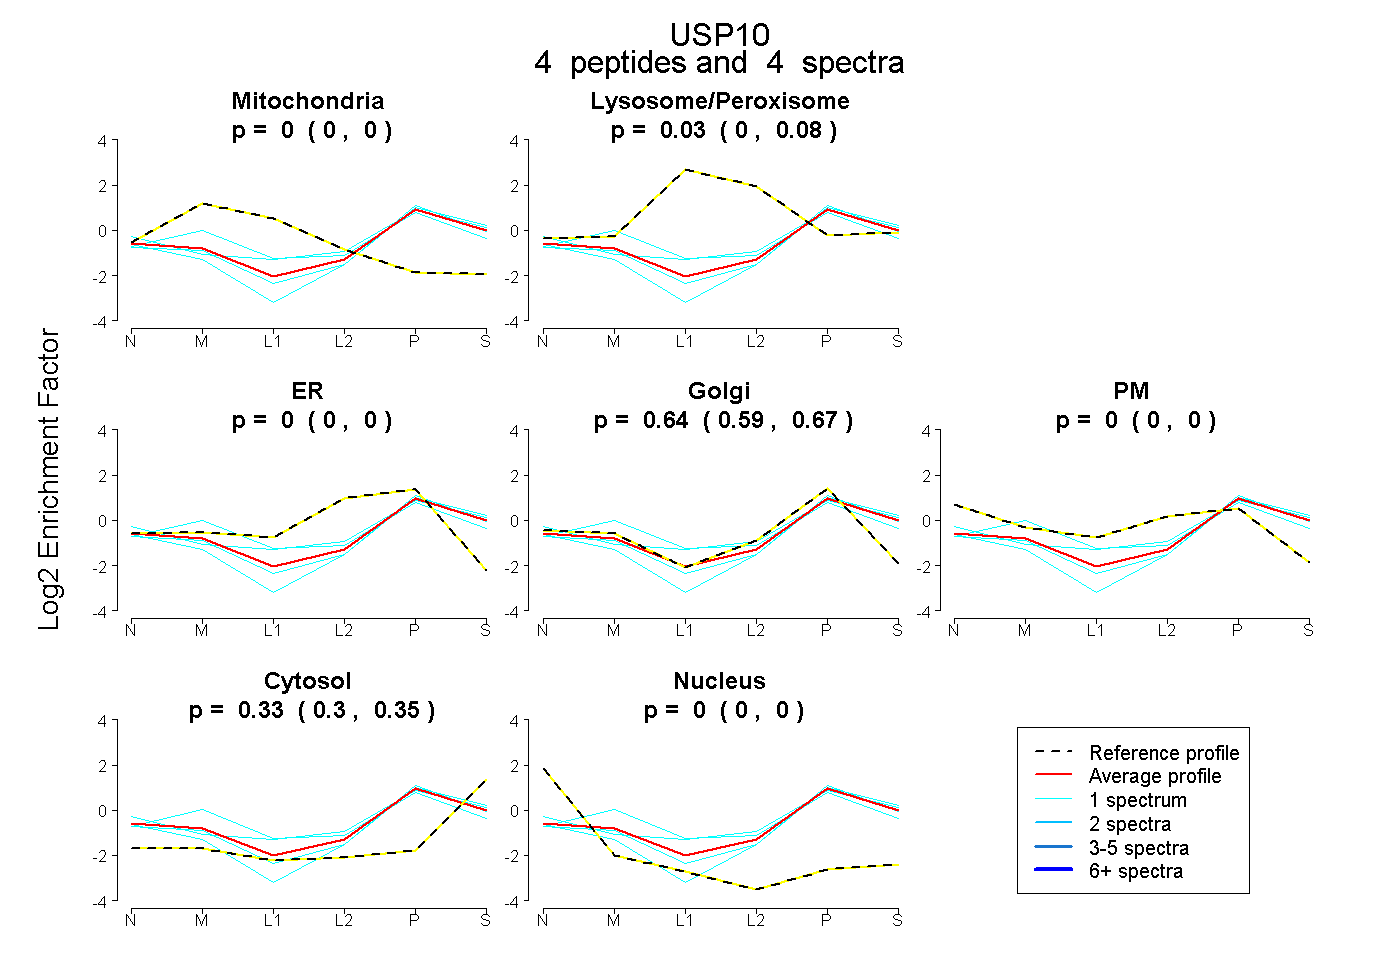 |
0.000 0.000 | 0.000 |
0.030 0.000 | 0.084 |
0.000 0.000 | 0.000 |
0.637 0.585 | 0.667 |
0.000 0.000 | 0.000 |
0.332 0.300 | 0.354 |
0.000 0.000 | 0.000 |
|||
| Plot | Lyso | Other | |||||||||||
| Expt C |
5 peptides |
11 spectra |
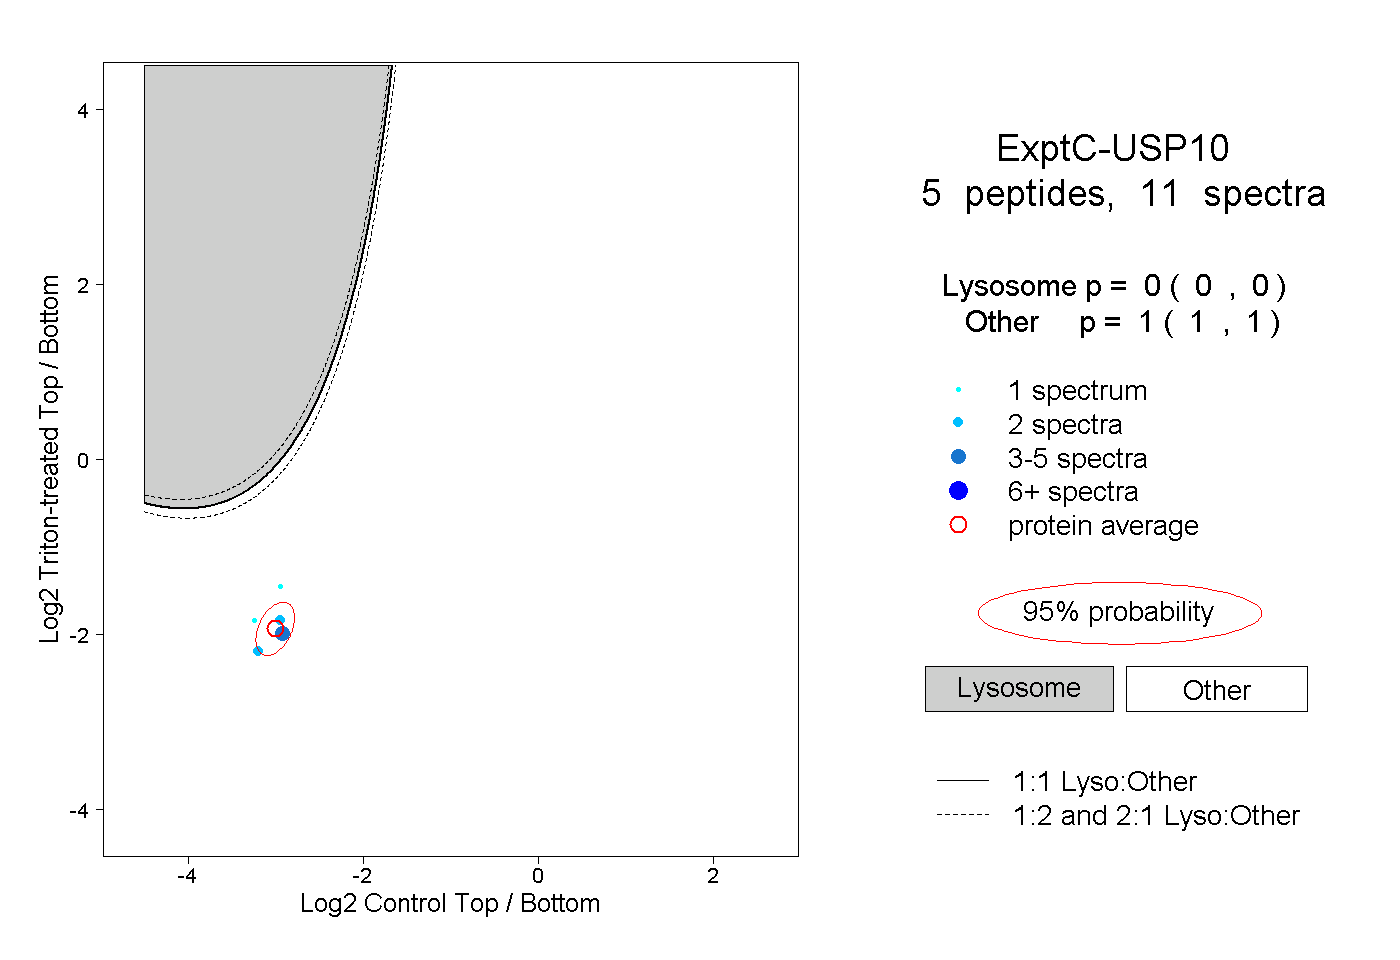 |
0.000 0.000 | 0.000 |
1.000 1.000 | 1.000 |