18
18peptides
spectra
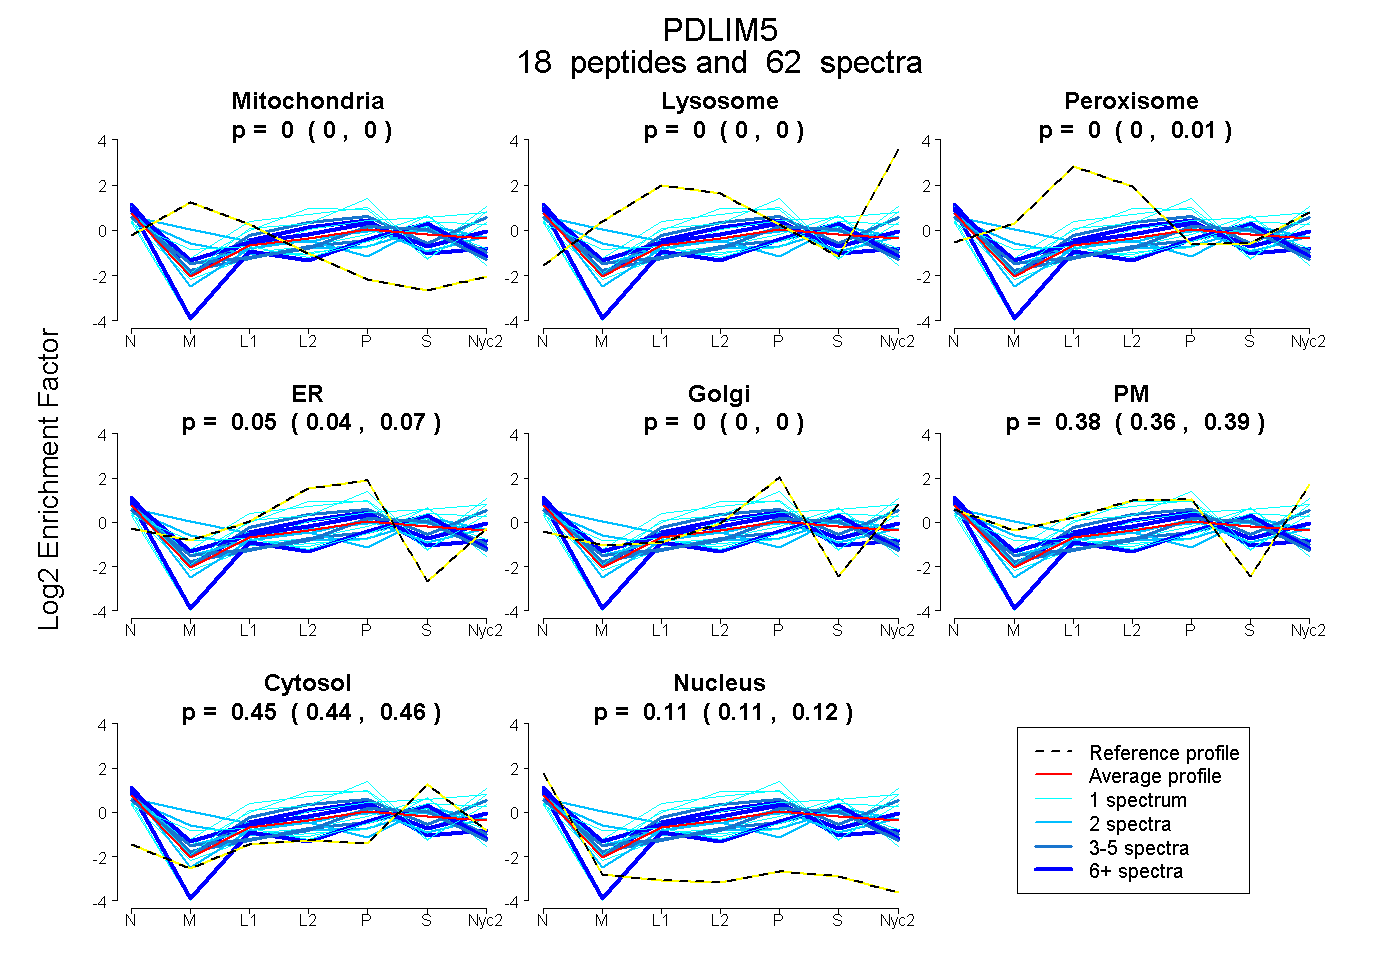
0.000 | 0.000
0.000 | 0.000
0.000 | 0.011
0.035 | 0.068
0.000 | 0.000
0.358 | 0.394
0.443 | 0.458
0.108 | 0.120
7peptides
spectra
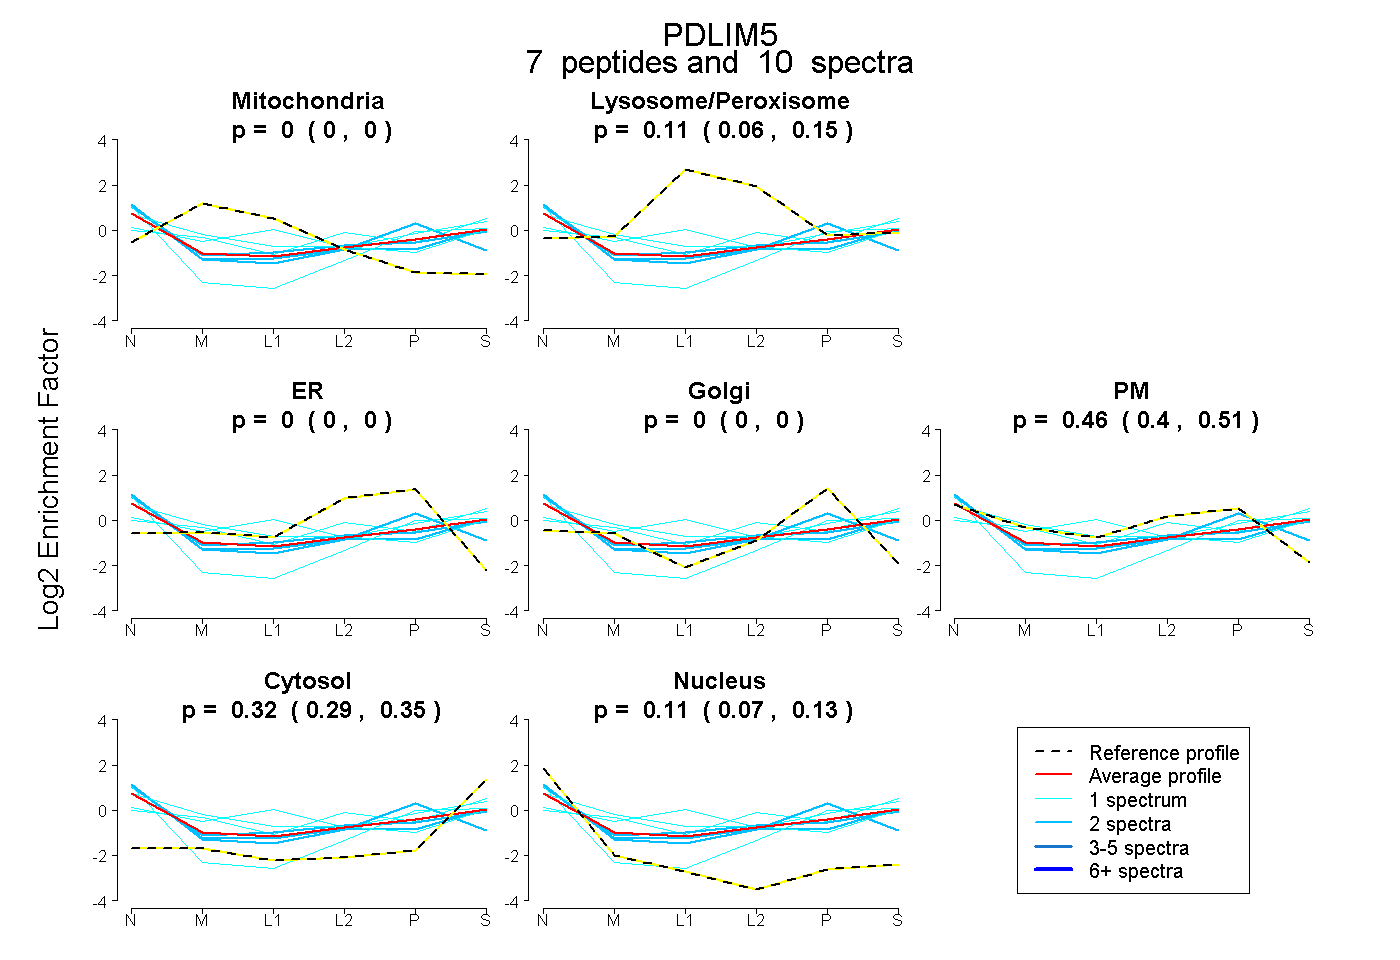
0.000 | 0.000
0.061 | 0.147
0.000 | 0.000
0.000 | 0.000
0.403 | 0.508
0.291 | 0.346
0.074 | 0.135
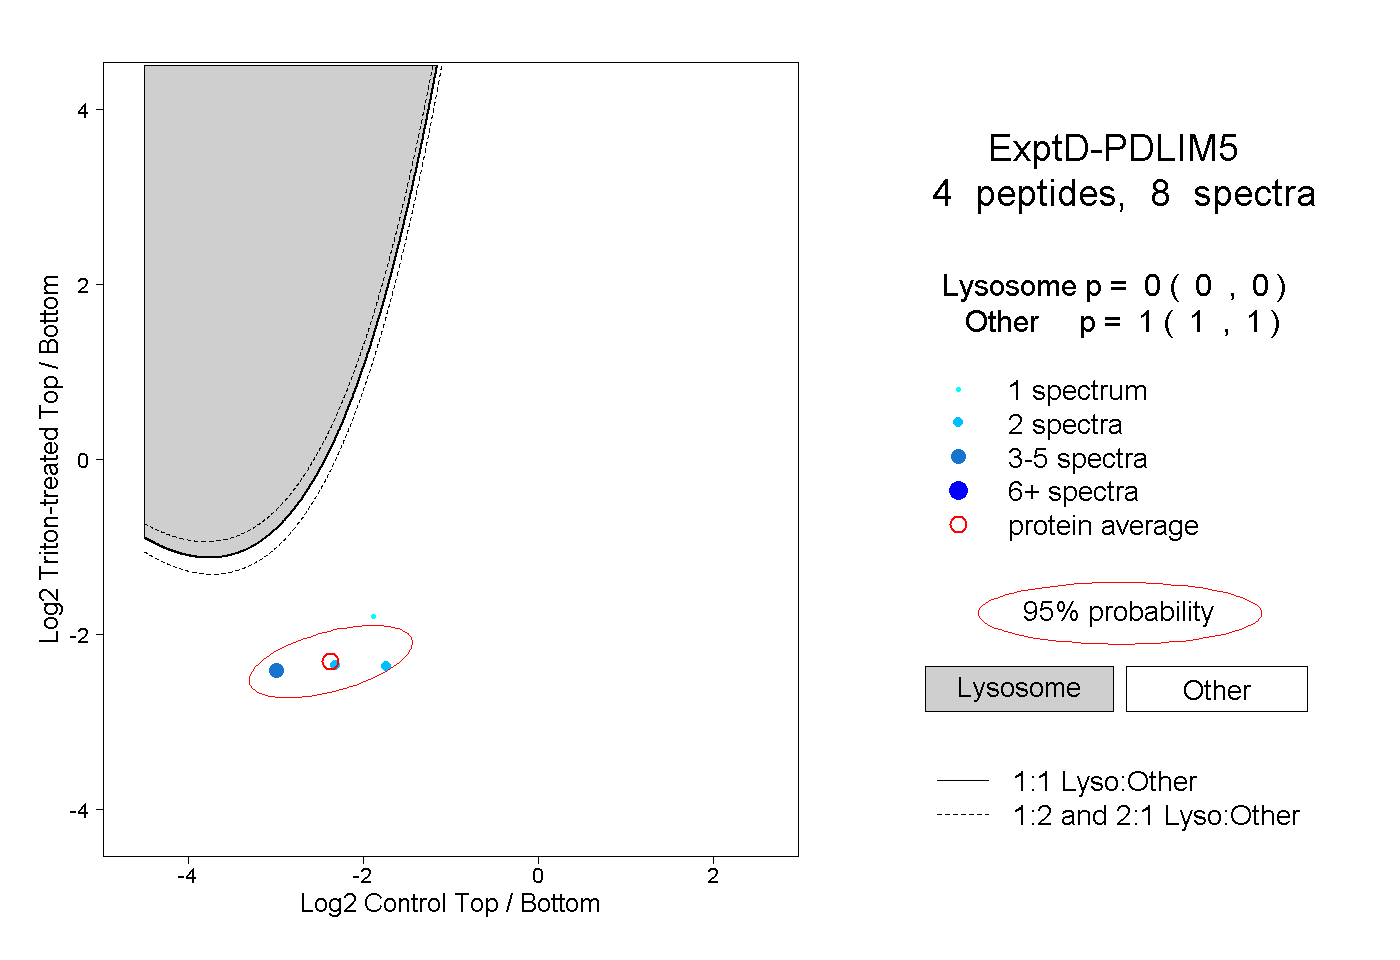
17peptides
spectra
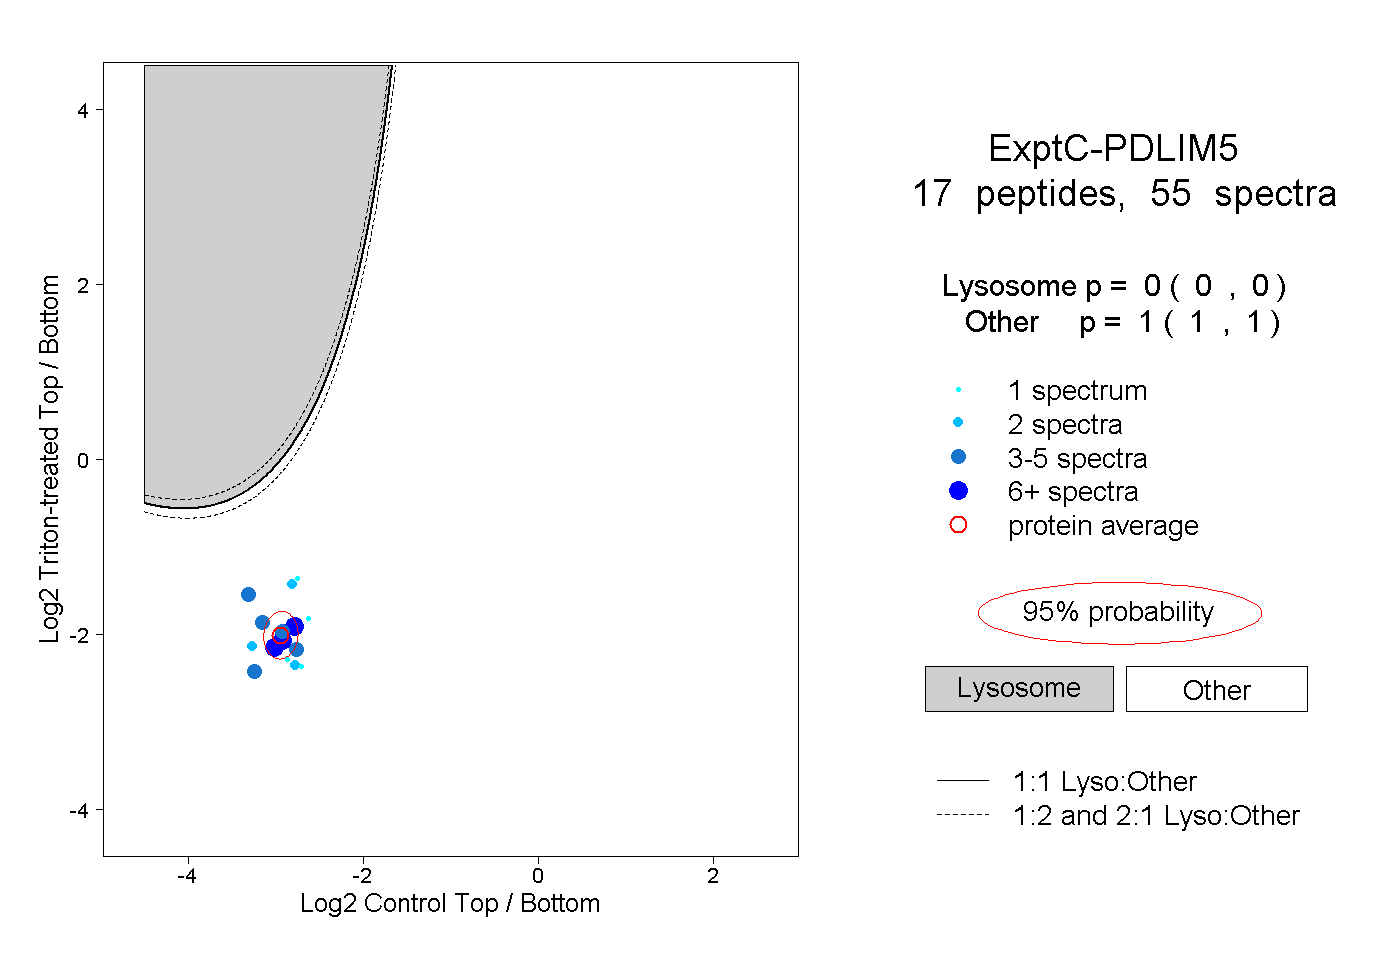
0.000 | 0.000
1.000 | 1.000