28
28peptides
spectra
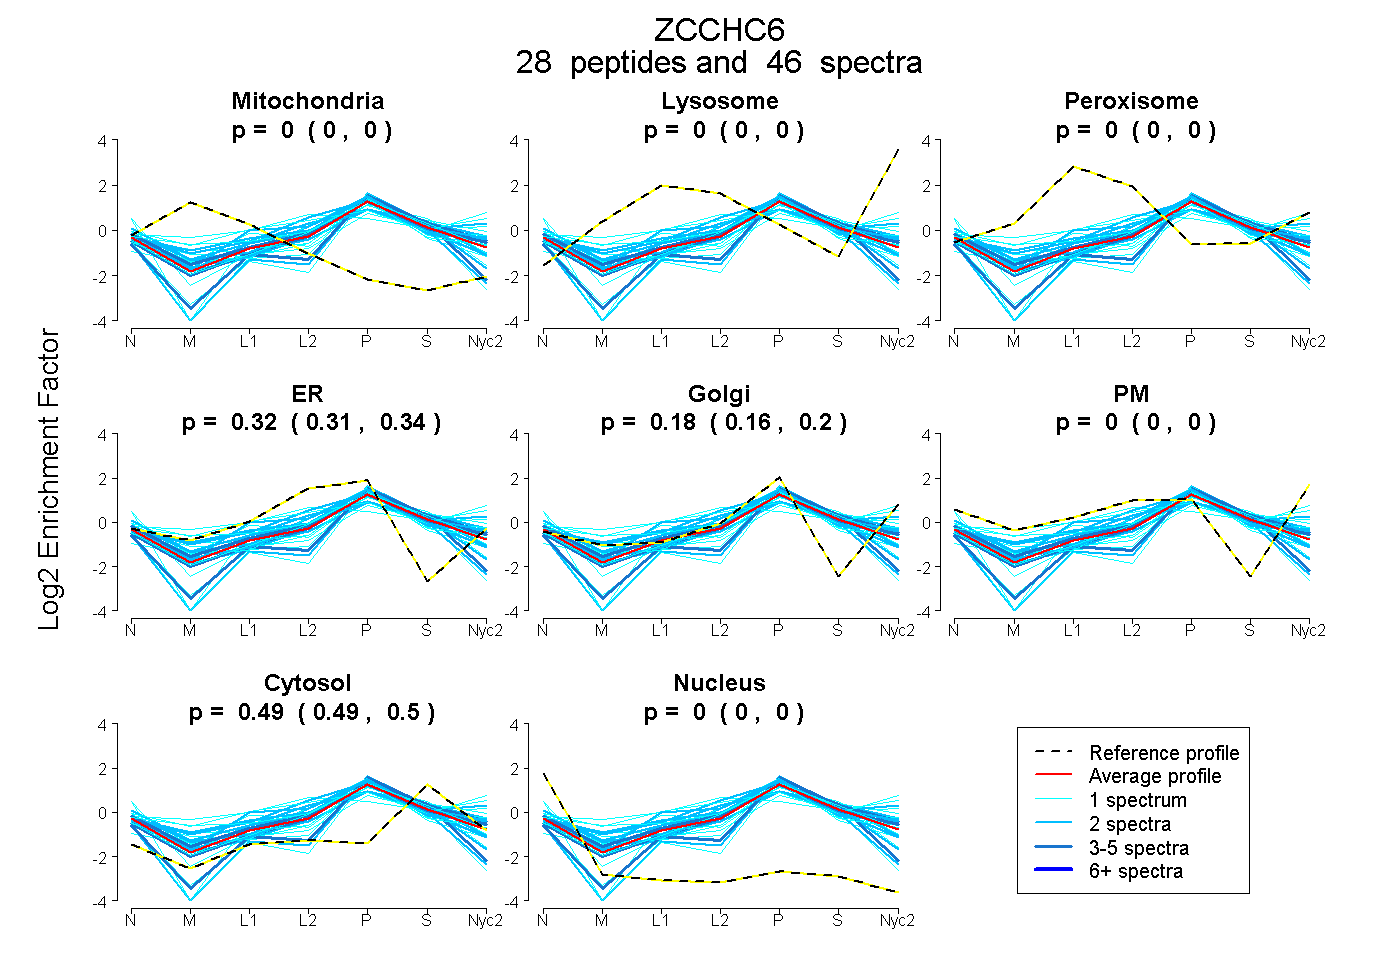
0.000 | 0.000
0.000 | 0.000
0.000 | 0.000
0.305 | 0.337
0.164 | 0.199
0.000 | 0.000
0.491 | 0.498
0.000 | 0.000
8peptides
spectra
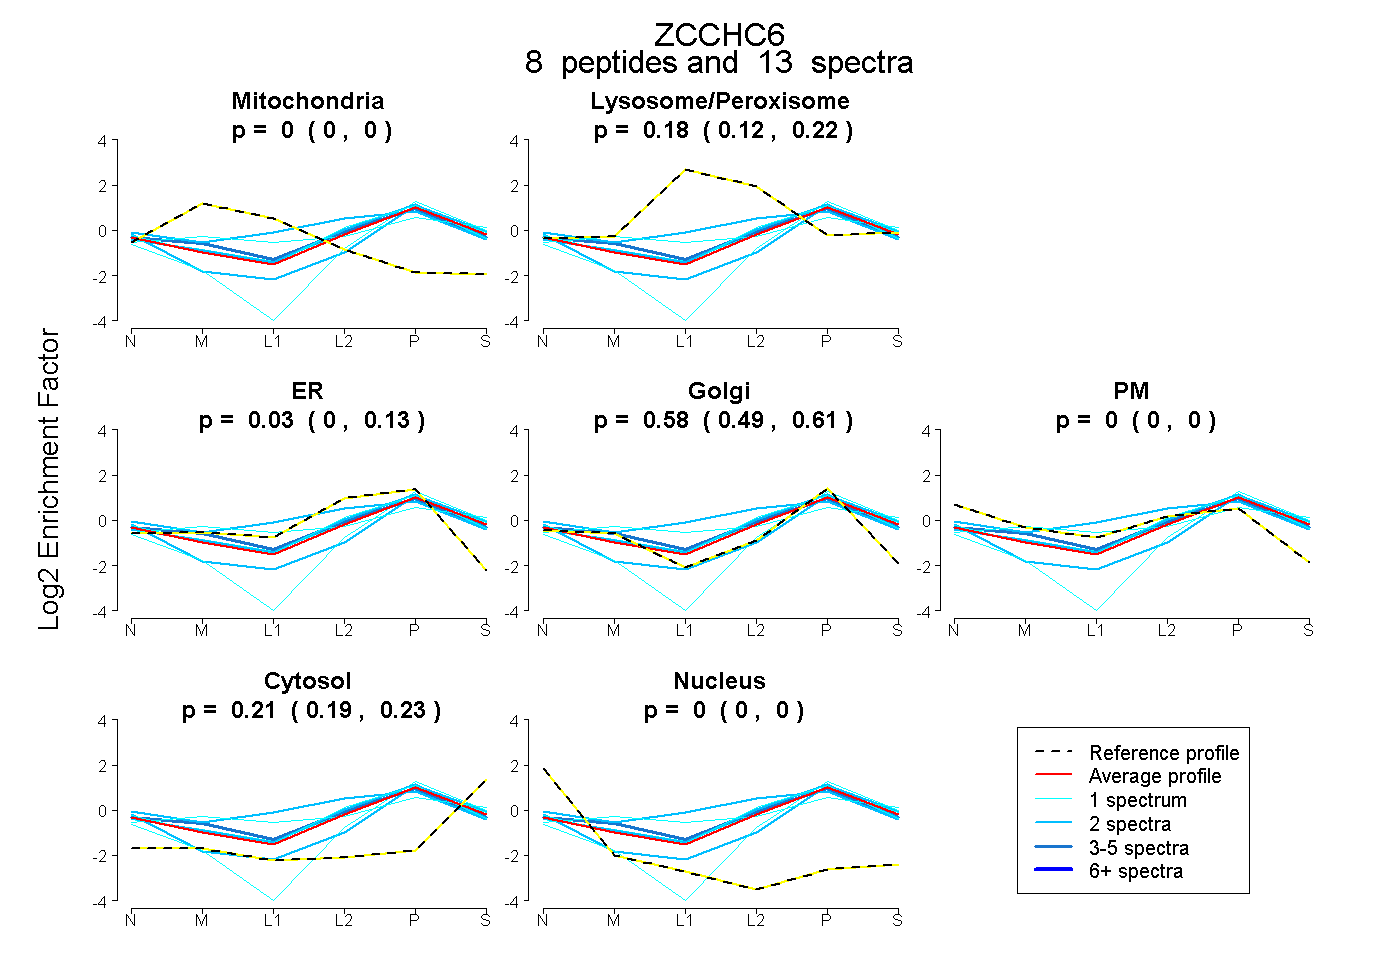
0.000 | 0.000
0.118 | 0.216
0.000 | 0.128
0.487 | 0.614
0.000 | 0.000
0.187 | 0.232
0.000 | 0.000