 2
2peptides
spectra
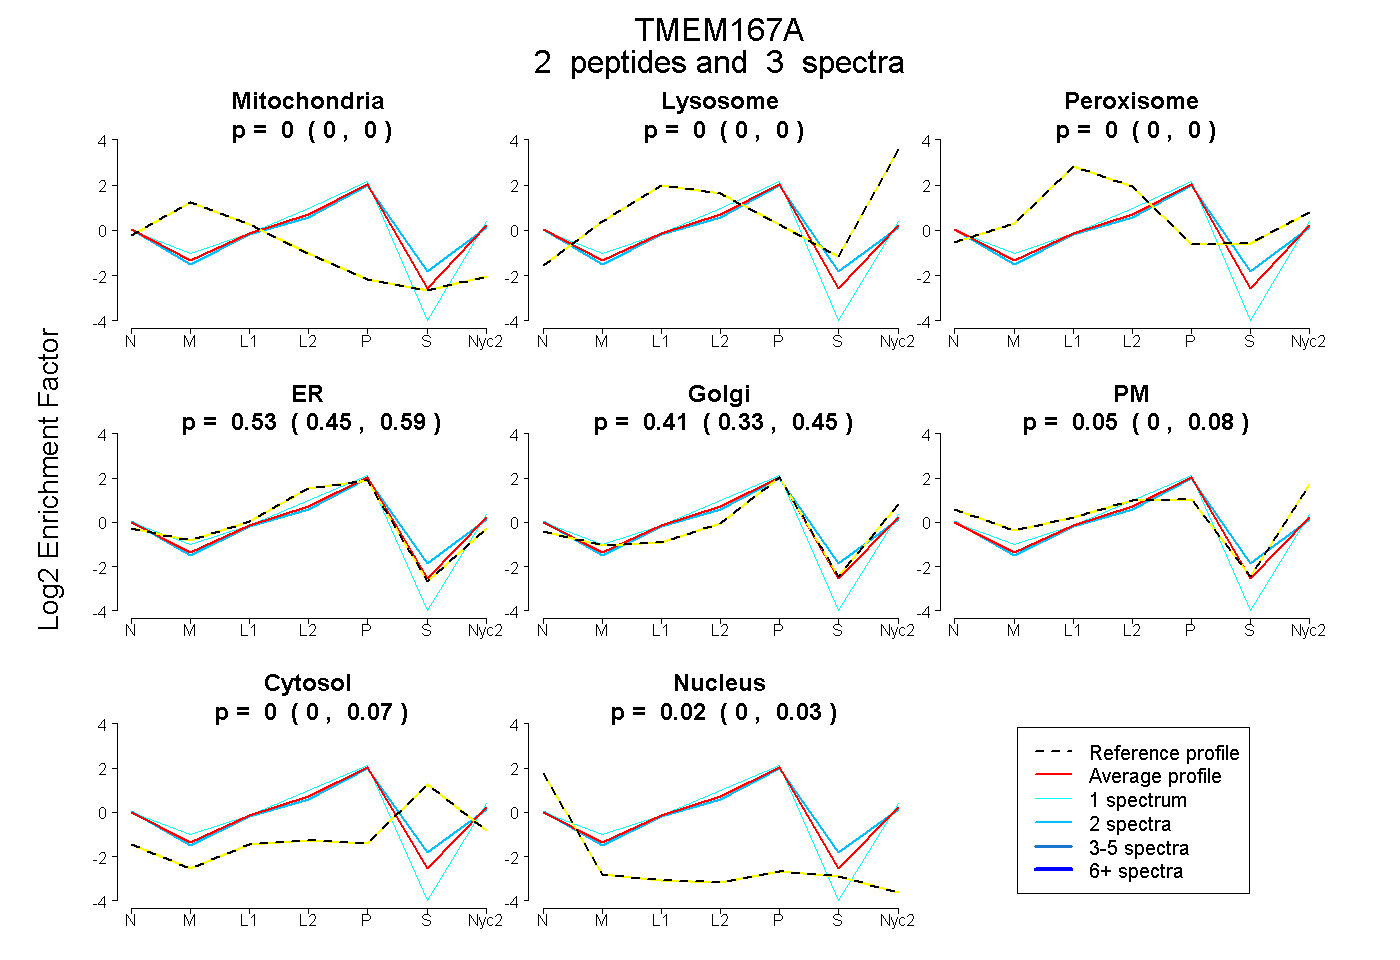
0.000 | 0.000
0.000 | 0.000
0.000 | 0.005
0.446 | 0.587
0.325 | 0.453
0.000 | 0.082
0.000 | 0.075
0.000 | 0.028
2peptides
spectra
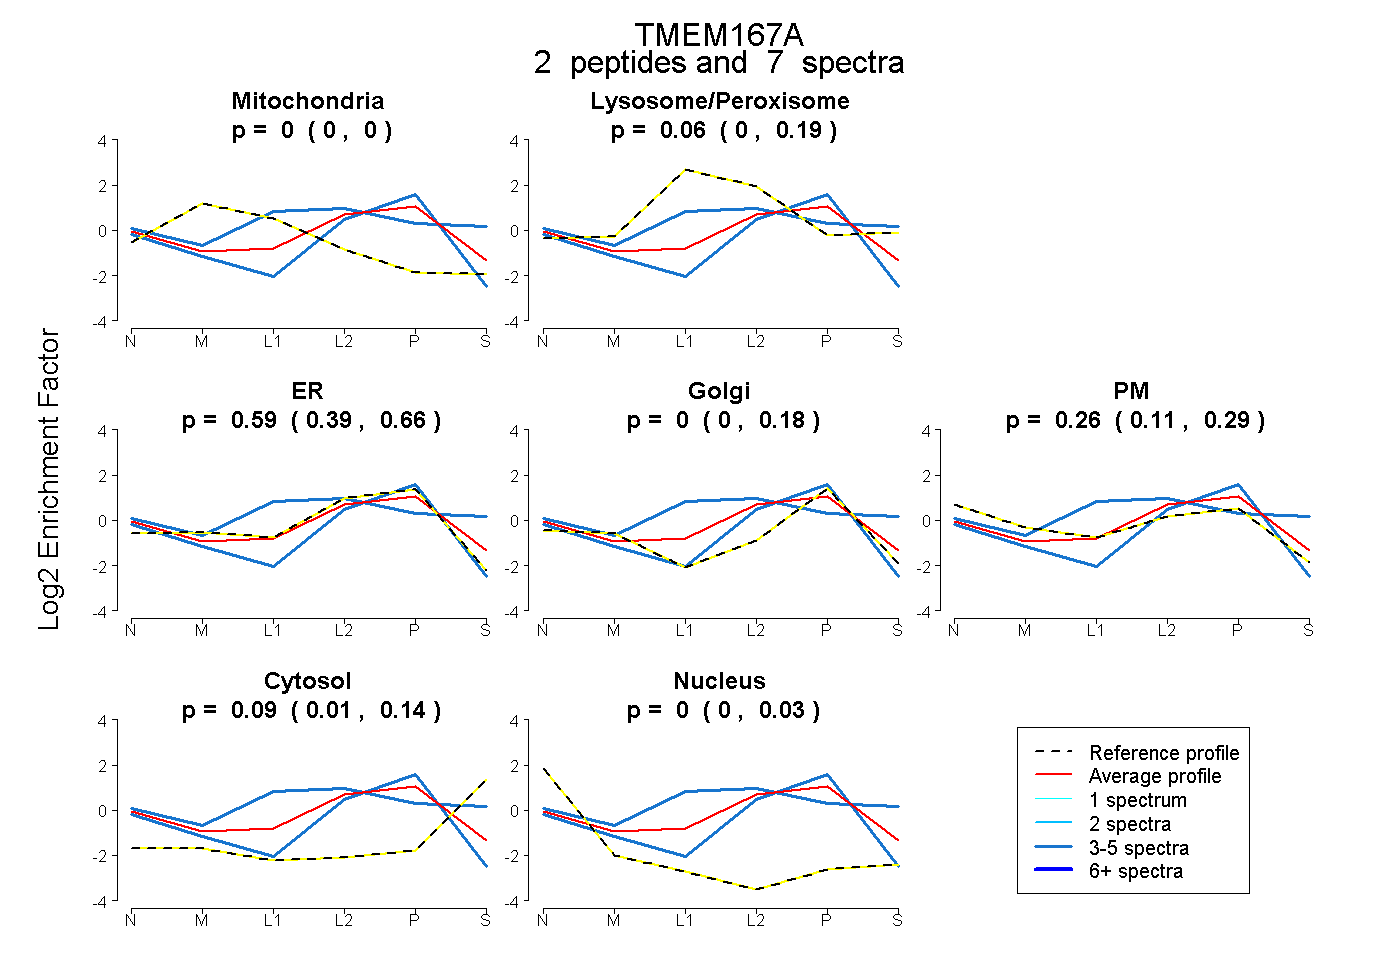
0.000 | 0.000
0.000 | 0.185
0.392 | 0.663
0.000 | 0.176
0.109 | 0.295
0.008 | 0.135
0.000 | 0.027
1peptide
spectra
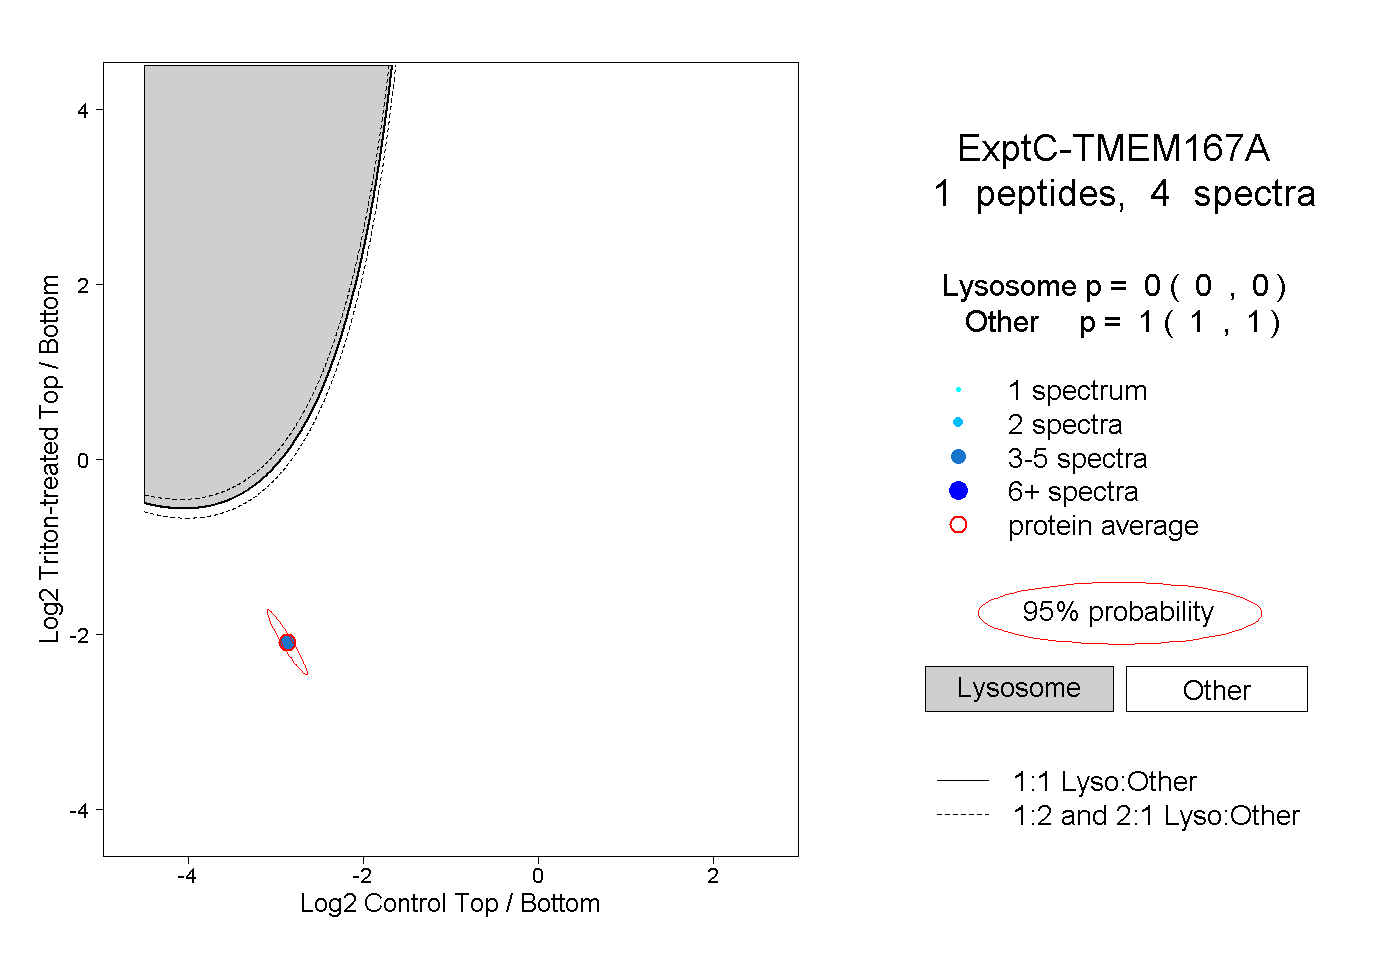
0.000 | 0.000
1.000 | 1.000