8
8peptides
spectra
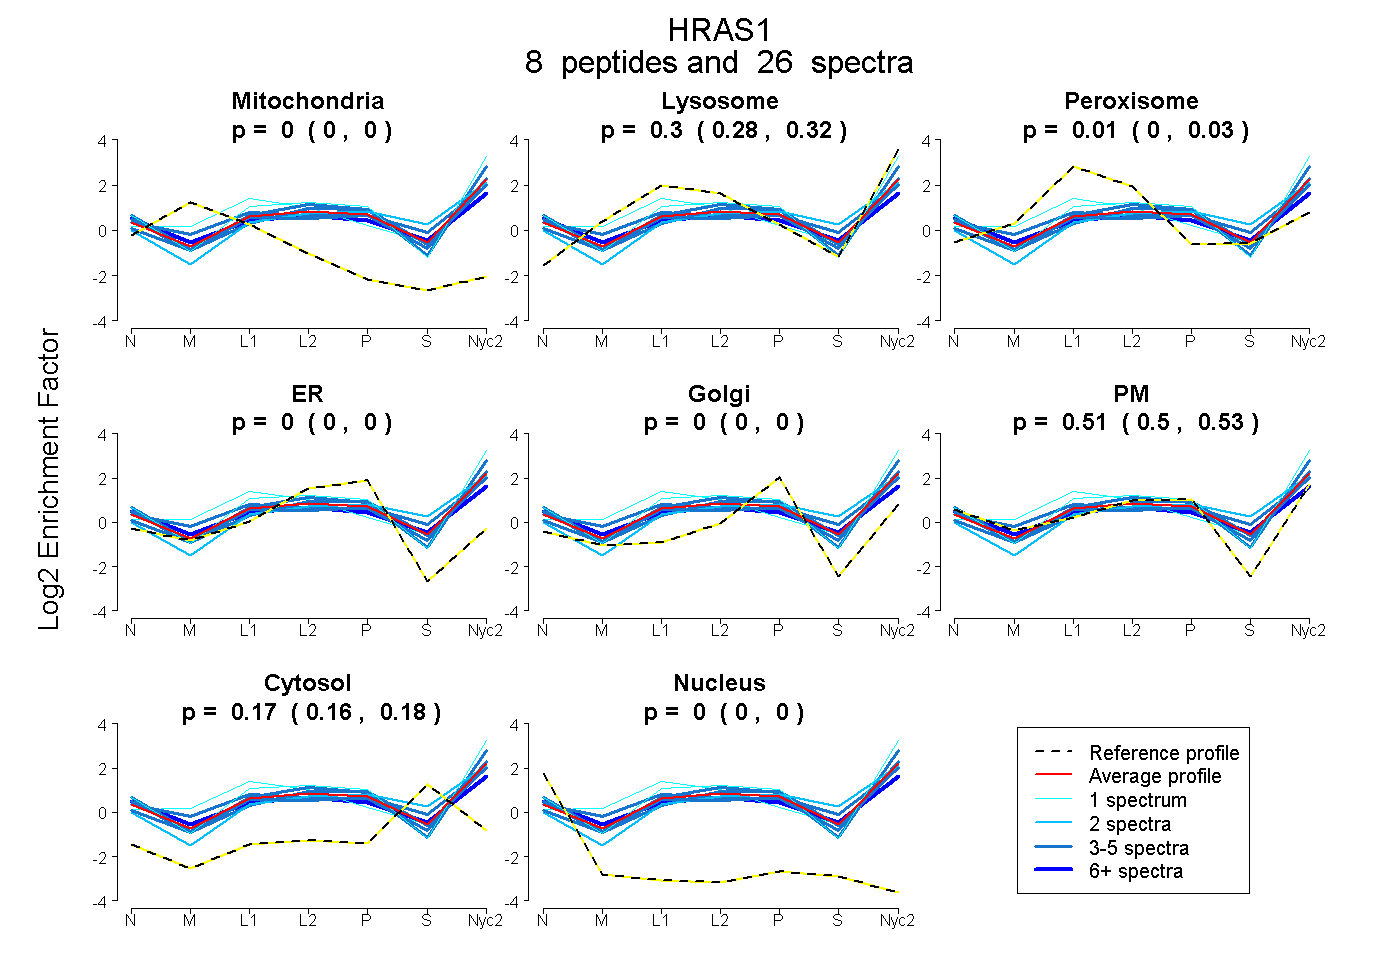
0.000 | 0.000
0.283 | 0.320
0.000 | 0.028
0.000 | 0.000
0.000 | 0.000
0.499 | 0.526
0.161 | 0.176
0.000 | 0.000
5peptides
spectra
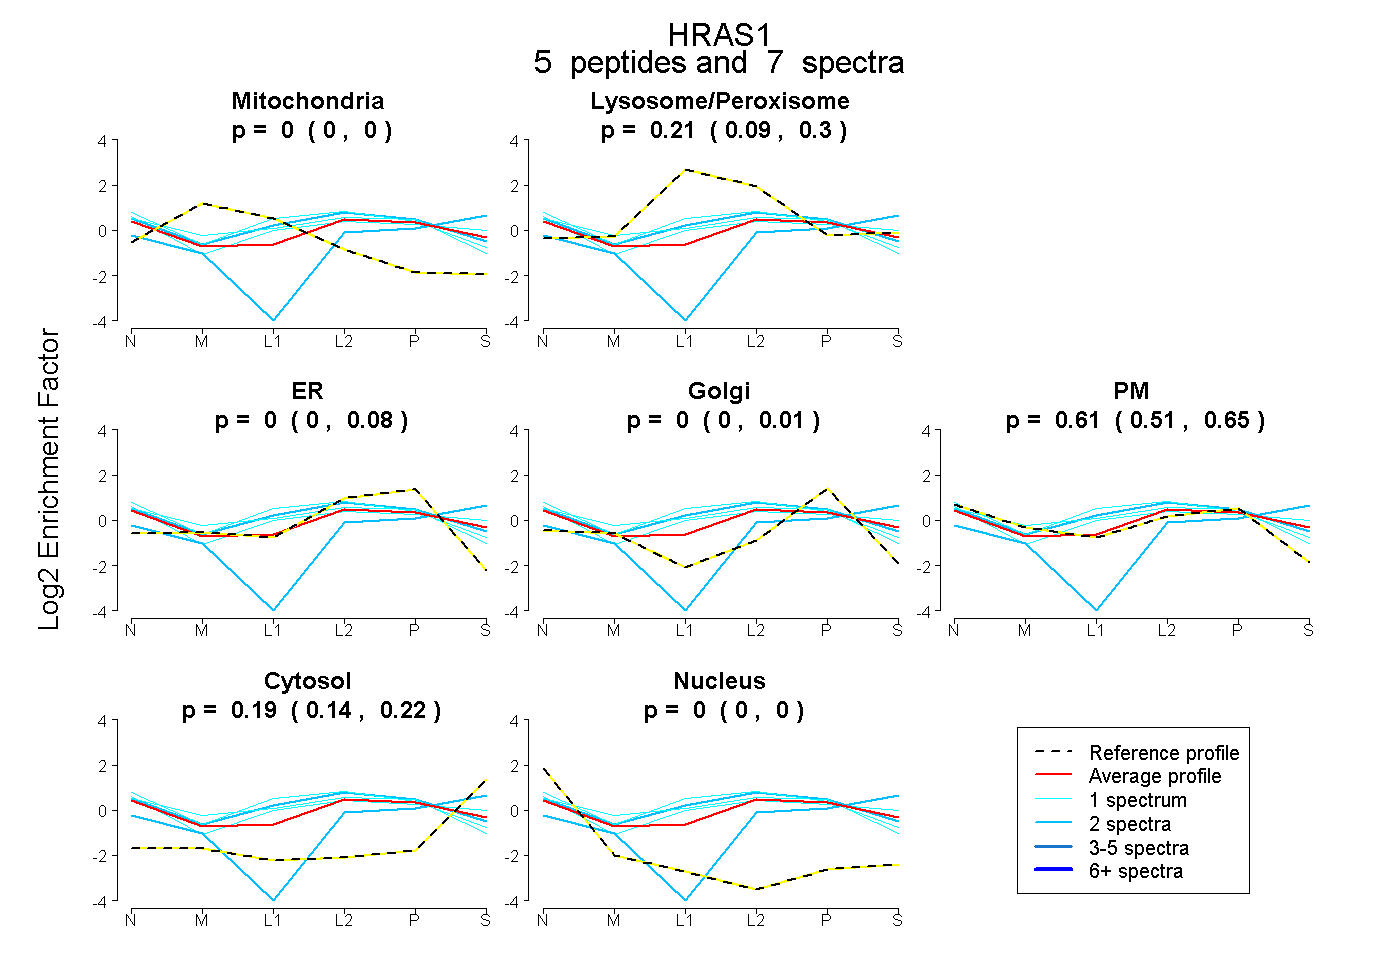
0.000 | 0.000
0.088 | 0.300
0.000 | 0.081
0.000 | 0.009
0.506 | 0.654
0.142 | 0.224
0.000 | 0.000
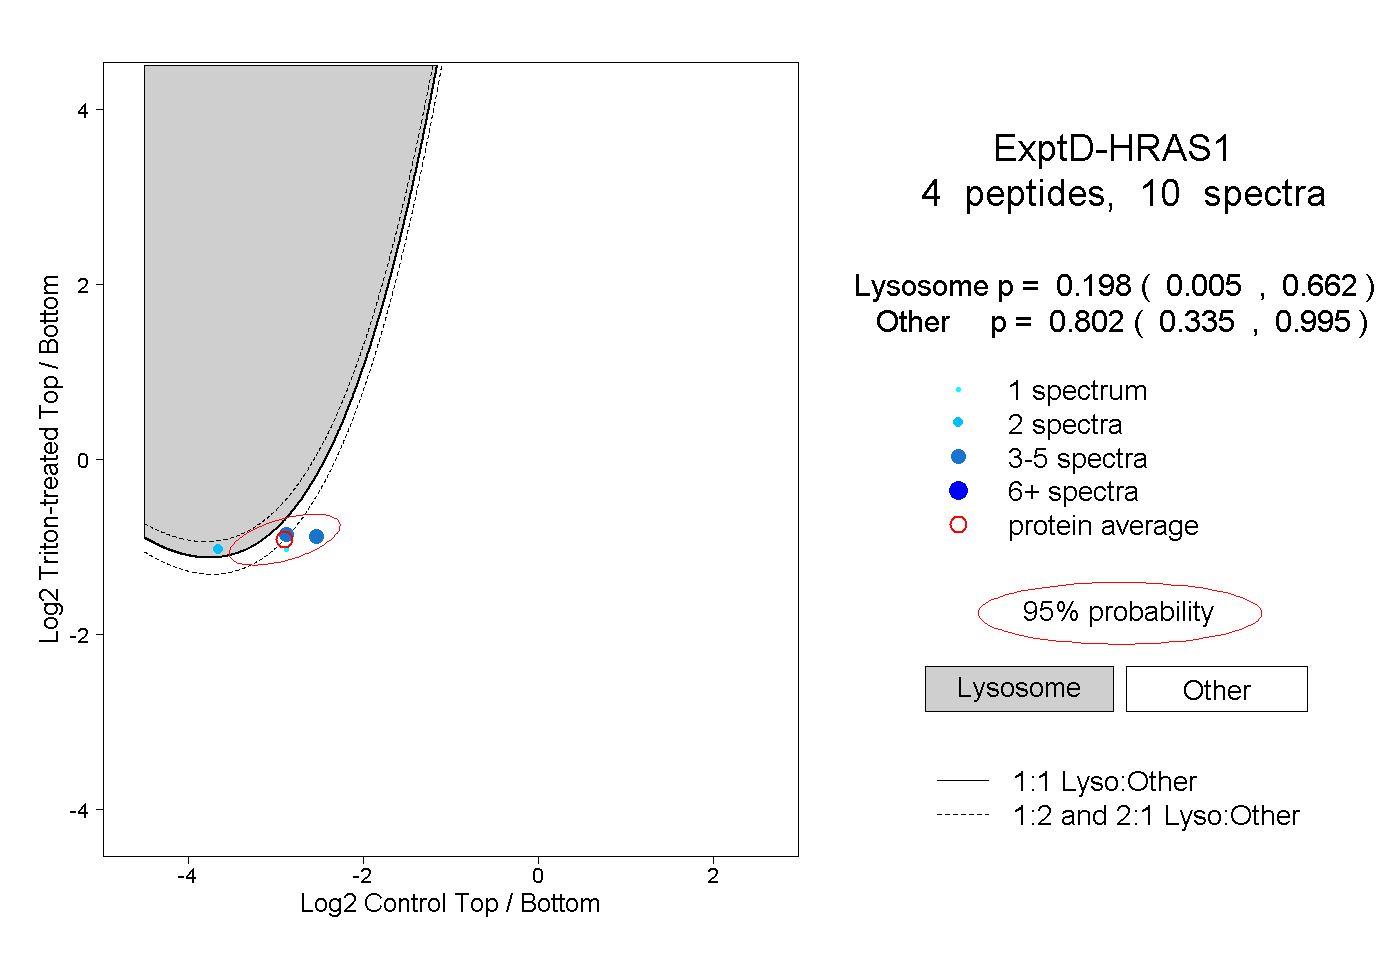
9peptides
spectra
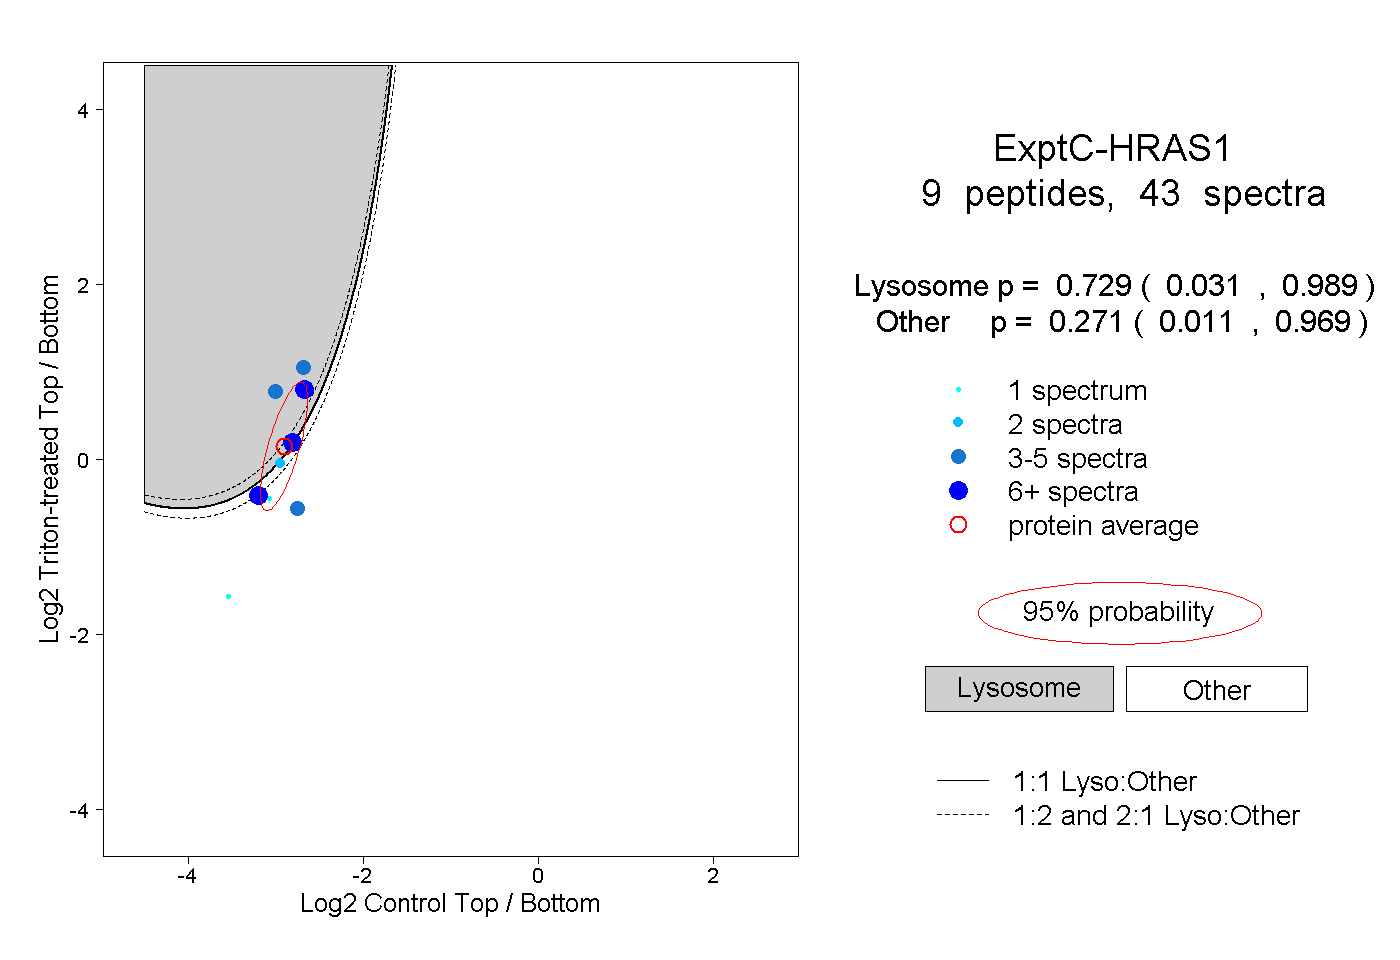
0.031 | 0.989
0.011 | 0.969