 8
8peptides
spectra
0.000 | 0.000
0.283 | 0.320
0.000 | 0.028
0.000 | 0.000
0.000 | 0.000
0.499 | 0.526
0.161 | 0.176
0.000 | 0.000
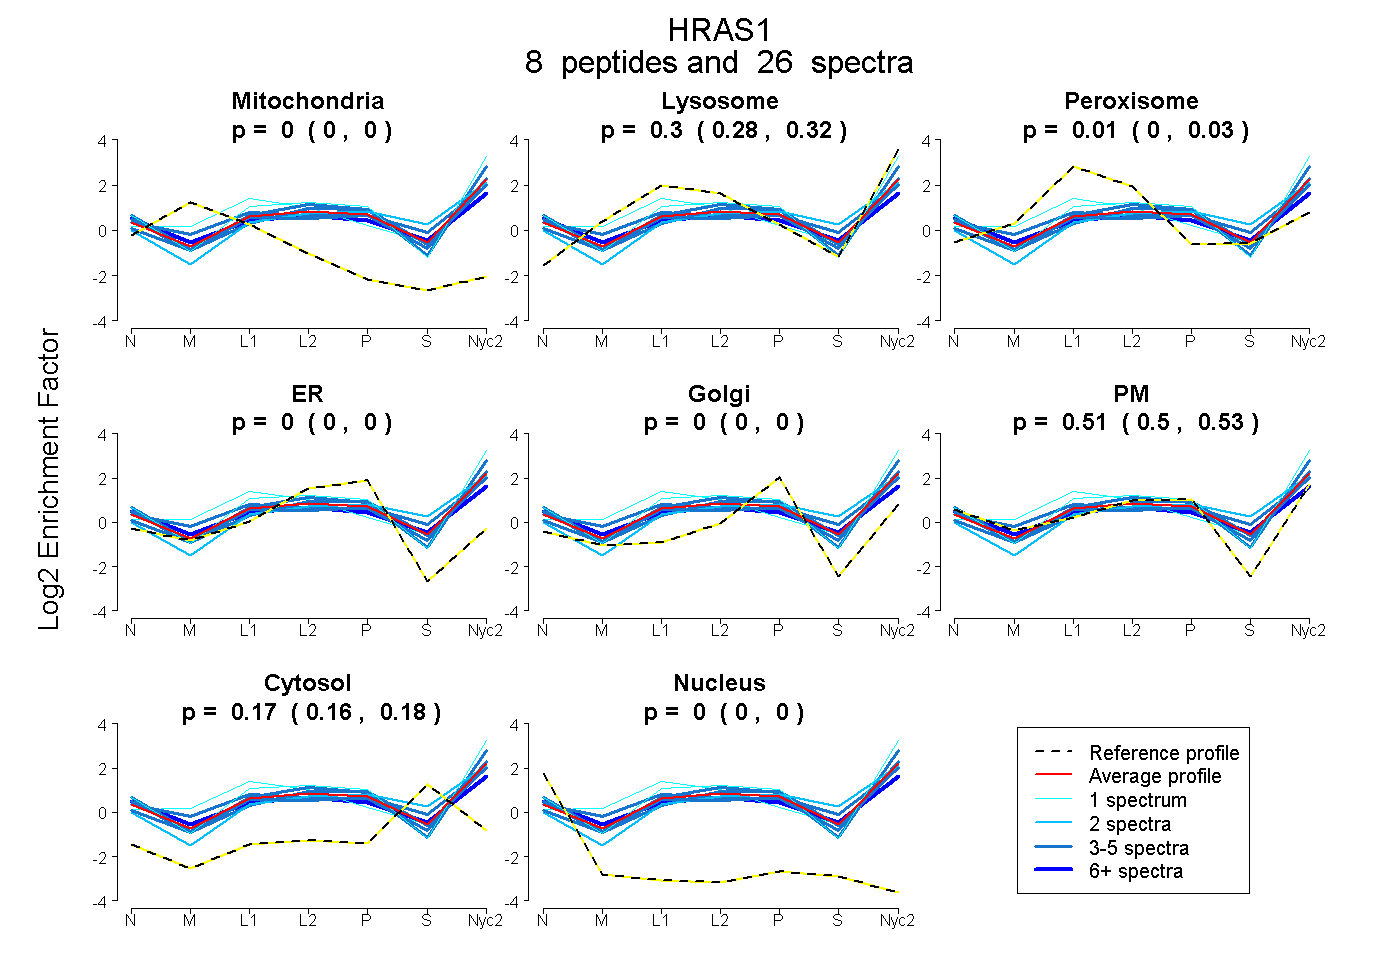
| Plot | Mito | Lyso | Perox | ER | Golgi | PM | Cytosol | Nucleus | |||||
| Expt A |
8 peptides |
26 spectra |
|
0.000 0.000 | 0.000 |
0.304 0.283 | 0.320 |
0.013 0.000 | 0.028 |
0.000 0.000 | 0.000 |
0.000 0.000 | 0.000 |
0.514 0.499 | 0.526 |
0.169 0.161 | 0.176 |
0.000 0.000 | 0.000 |
| 4 spectra, SFEDIHQYR | 0.000 | 0.330 | 0.008 | 0.000 | 0.000 | 0.394 | 0.267 | 0.000 | ||
| 1 spectrum, DSDDVPMVLVGNK | 0.000 | 0.339 | 0.272 | 0.000 | 0.000 | 0.314 | 0.075 | 0.000 | ||
| 2 spectra, QGVEDAFYTLVR | 0.000 | 0.345 | 0.000 | 0.000 | 0.000 | 0.339 | 0.316 | 0.000 | ||
| 3 spectra, LVVVGAGGVGK | 0.000 | 0.212 | 0.000 | 0.000 | 0.000 | 0.611 | 0.176 | 0.000 | ||
| 1 spectrum, SYGIPYIETSAK | 0.000 | 0.392 | 0.000 | 0.000 | 0.000 | 0.608 | 0.000 | 0.000 | ||
| 3 spectra, LNPPDESGPGCMSCK | 0.000 | 0.311 | 0.052 | 0.000 | 0.000 | 0.523 | 0.114 | 0.000 | ||
| 4 spectra, QAQDLAR | 0.000 | 0.293 | 0.000 | 0.000 | 0.000 | 0.655 | 0.052 | 0.000 | ||
| 8 spectra, CDLAAR | 0.000 | 0.115 | 0.144 | 0.000 | 0.000 | 0.533 | 0.207 | 0.000 |
| Plot | Mito | Lyso or Perox | ER | Golgi | PM | Cytosol | Nucleus | ||||||
| Expt B |
5 peptides |
7 spectra |
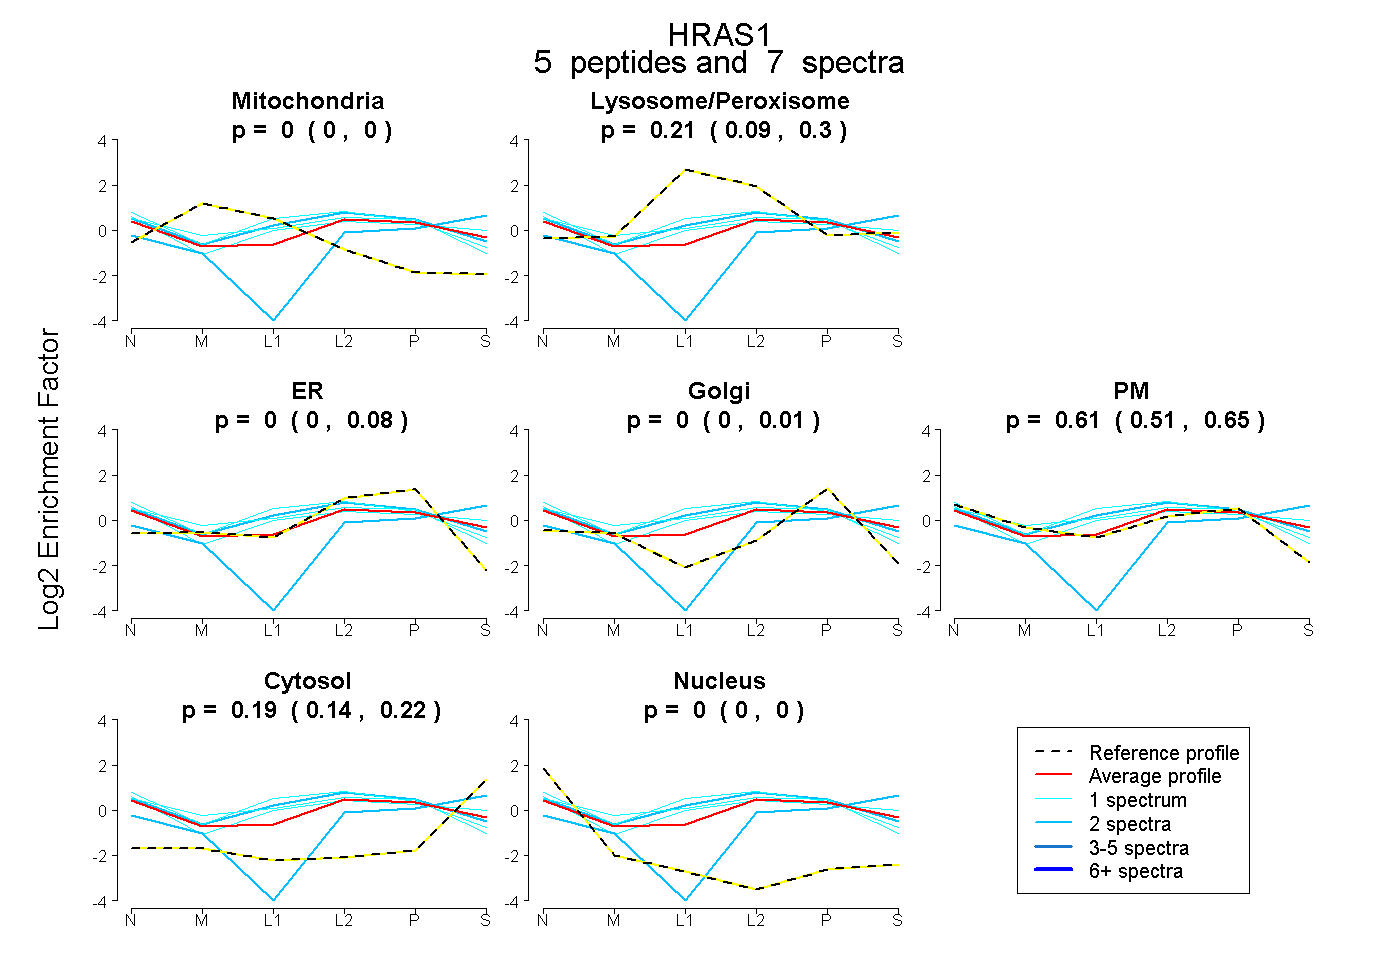 |
0.000 0.000 | 0.000 |
0.205 0.088 | 0.300 |
0.000 0.000 | 0.081 |
0.000 0.000 | 0.009 |
0.609 0.506 | 0.654 |
0.186 0.142 | 0.224 |
0.000 0.000 | 0.000 |
|||
| Plot | Lyso | Other | |||||||||||
| Expt C |
9 peptides |
43 spectra |
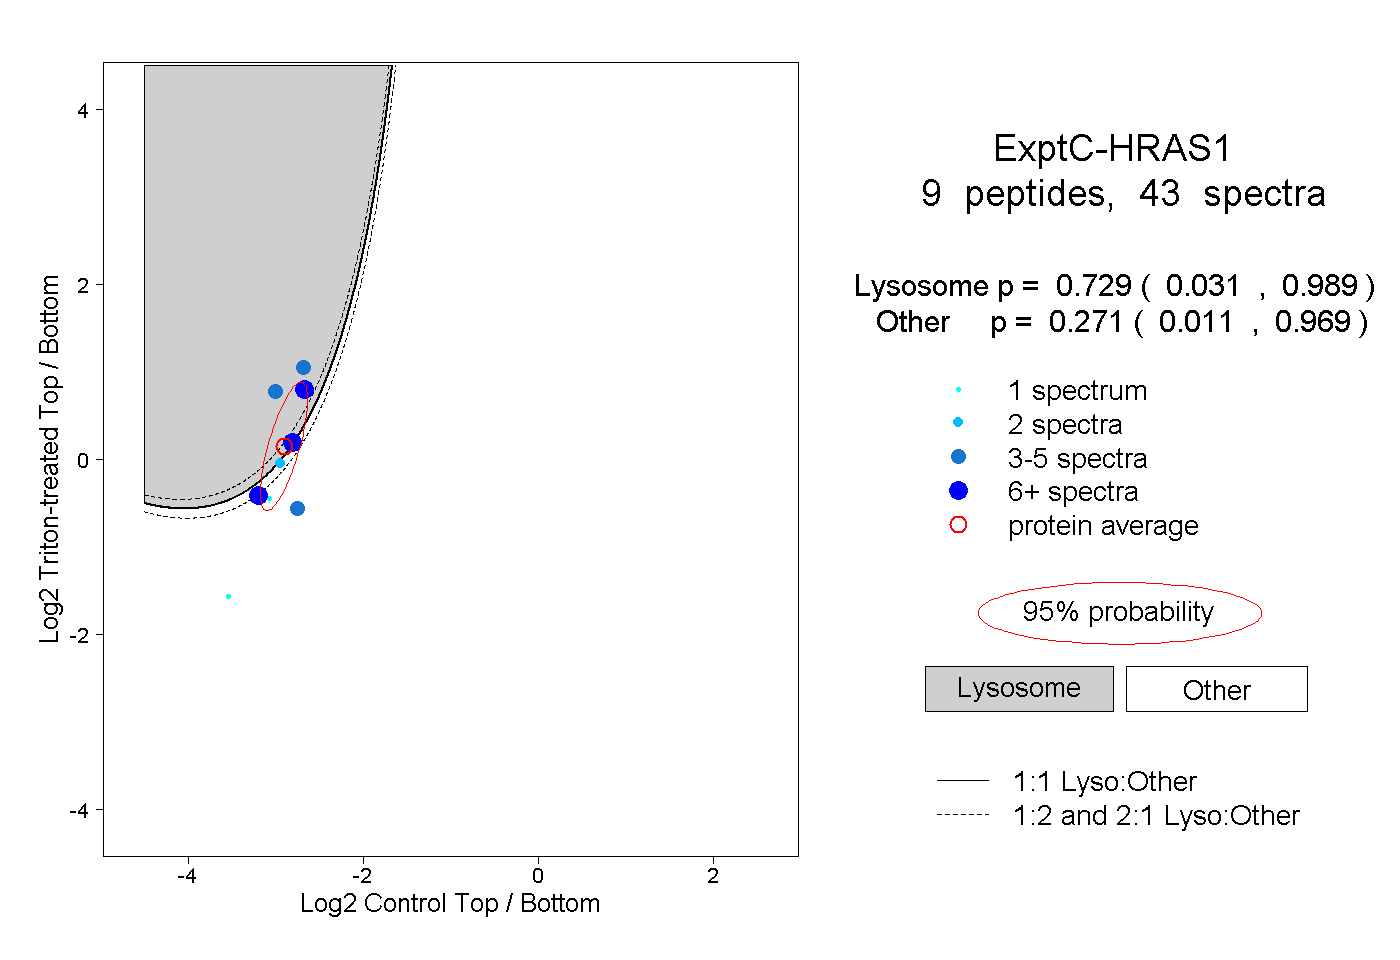 |
0.729 0.031 | 0.989 |
0.271 0.011 | 0.969 |
||||||||
| Plot | Lyso | Other | |||||||||||
| Expt D |
4 peptides |
10 spectra |
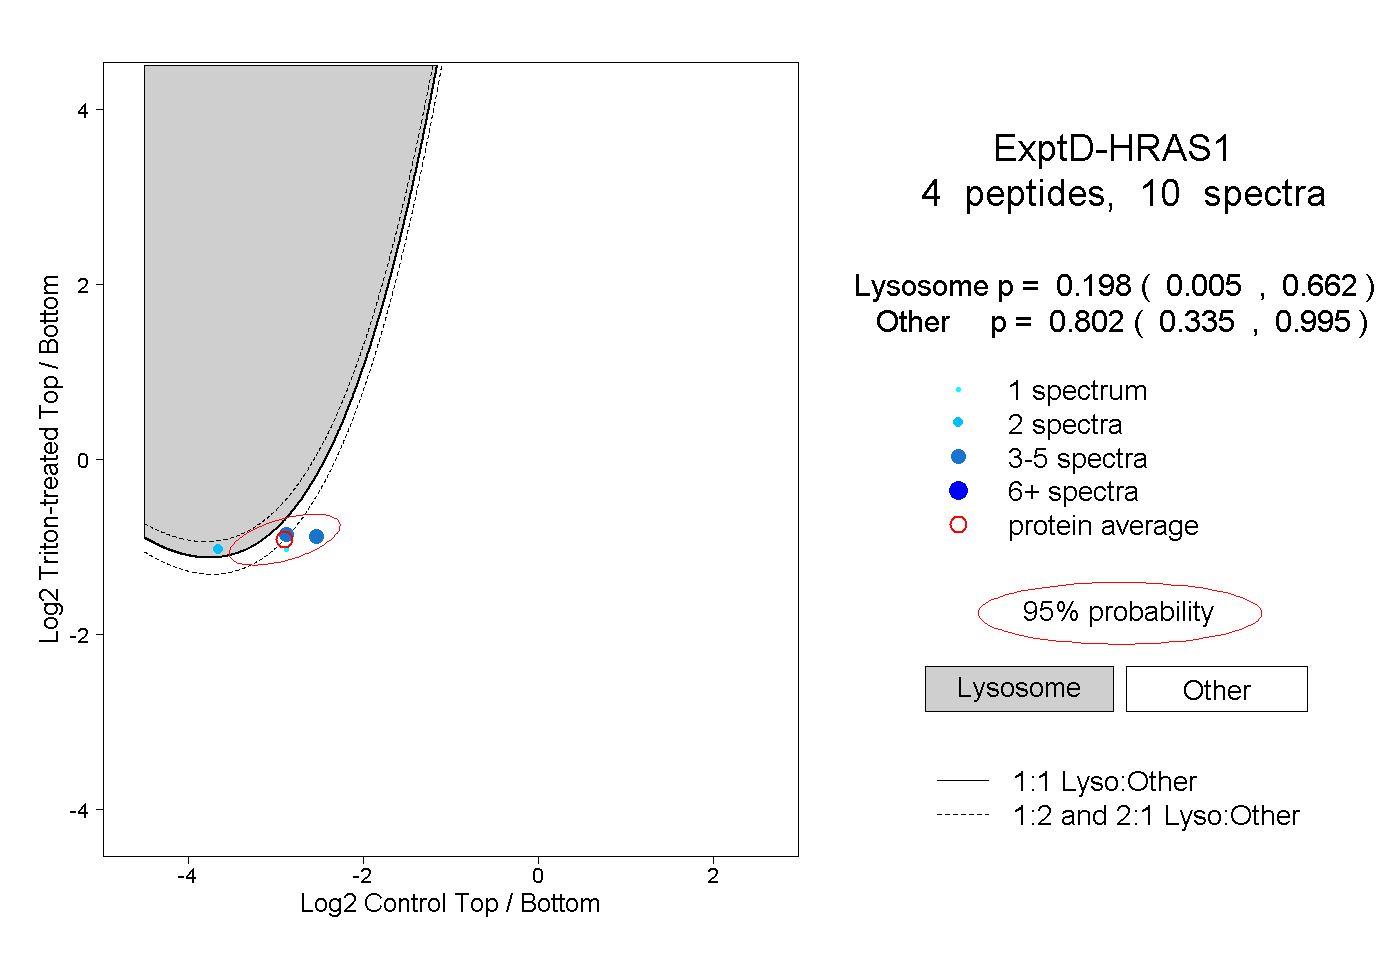 |
0.198 0.005 | 0.662 |
0.802 0.335 | 0.995 |