 3
3peptides
spectra
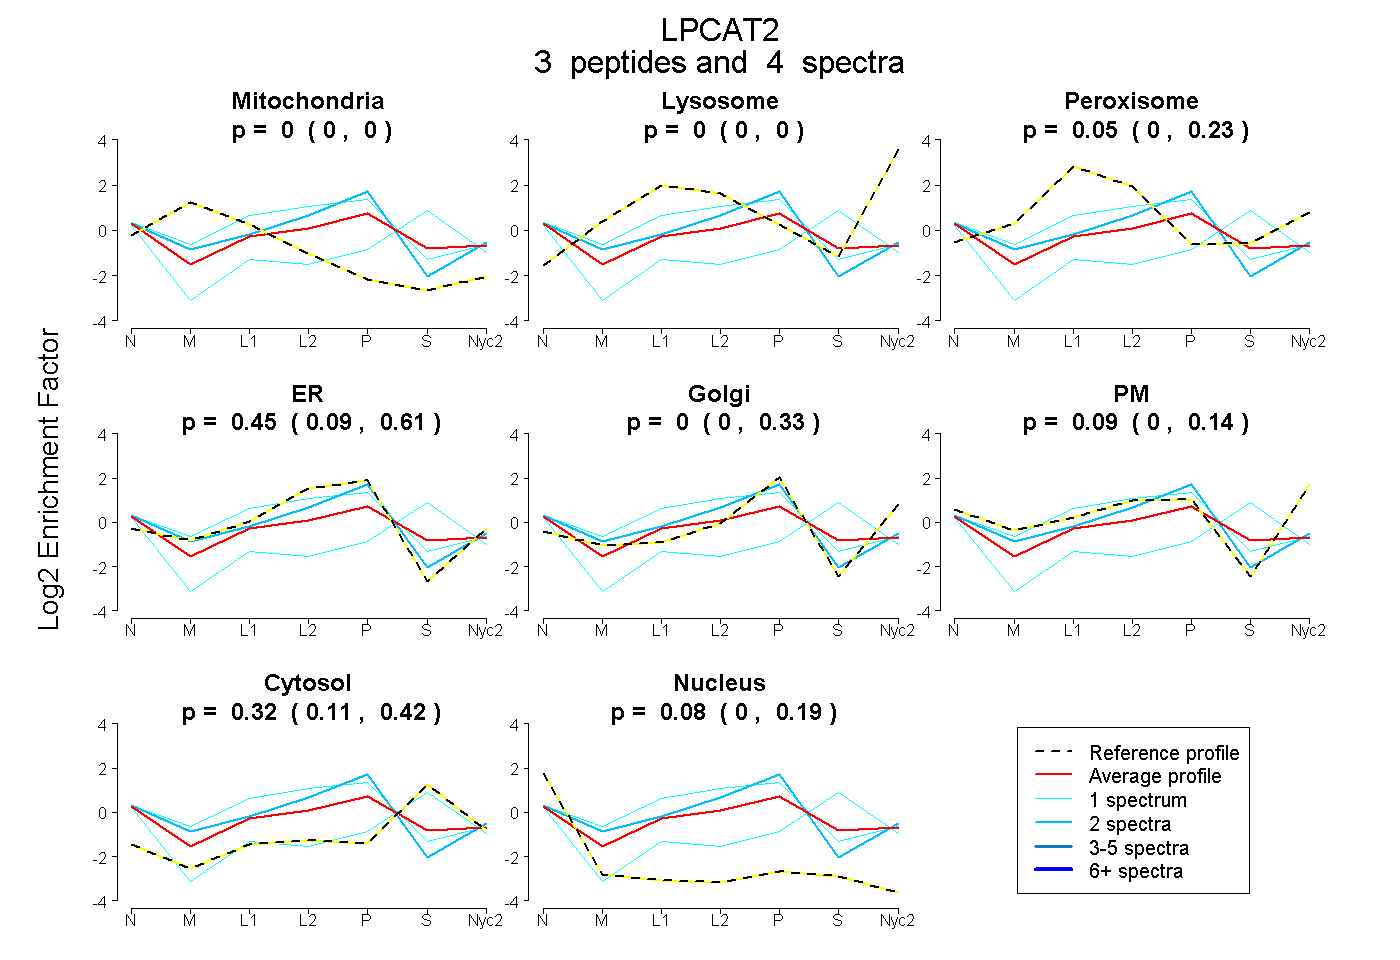
0.000 | 0.000
0.000 | 0.000
0.000 | 0.227
0.092 | 0.613
0.000 | 0.330
0.000 | 0.139
0.105 | 0.425
0.000 | 0.186
1peptide
spectra
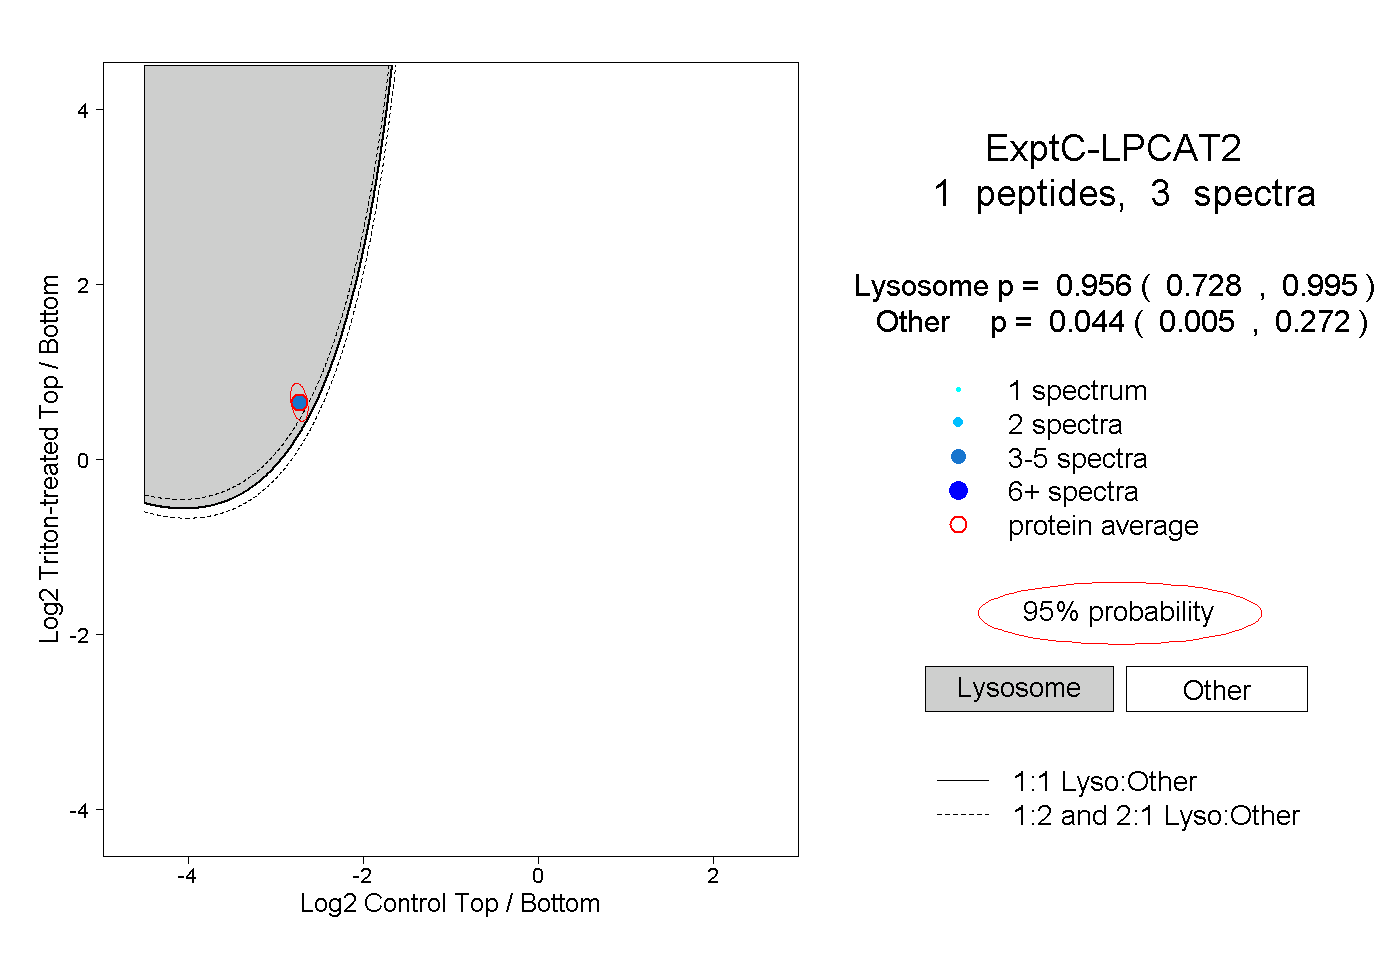
0.728 | 0.995
0.005 | 0.272
| Plot | Mito | Lyso | Perox | ER | Golgi | PM | Cytosol | Nucleus | |||||
| Expt A |
3 peptides |
4 spectra |
|
0.000 0.000 | 0.000 |
0.000 0.000 | 0.000 |
0.053 0.000 | 0.227 |
0.455 0.092 | 0.613 |
0.000 0.000 | 0.330 |
0.092 0.000 | 0.139 |
0.315 0.105 | 0.425 |
0.085 0.000 | 0.186 |
||
| Plot | Lyso | Other | |||||||||||
| Expt C |
1 peptide |
3 spectra |
|
0.956 0.728 | 0.995 |
0.044 0.005 | 0.272 |