 8
8peptides
spectra
0.000 | 0.000
0.978 | 0.997
0.001 | 0.020
0.000 | 0.000
0.000 | 0.000
0.000 | 0.000
0.000 | 0.000
0.000 | 0.000
| Plot | Mito | Lyso | Perox | ER | Golgi | PM | Cytosol | Nucleus | |||||
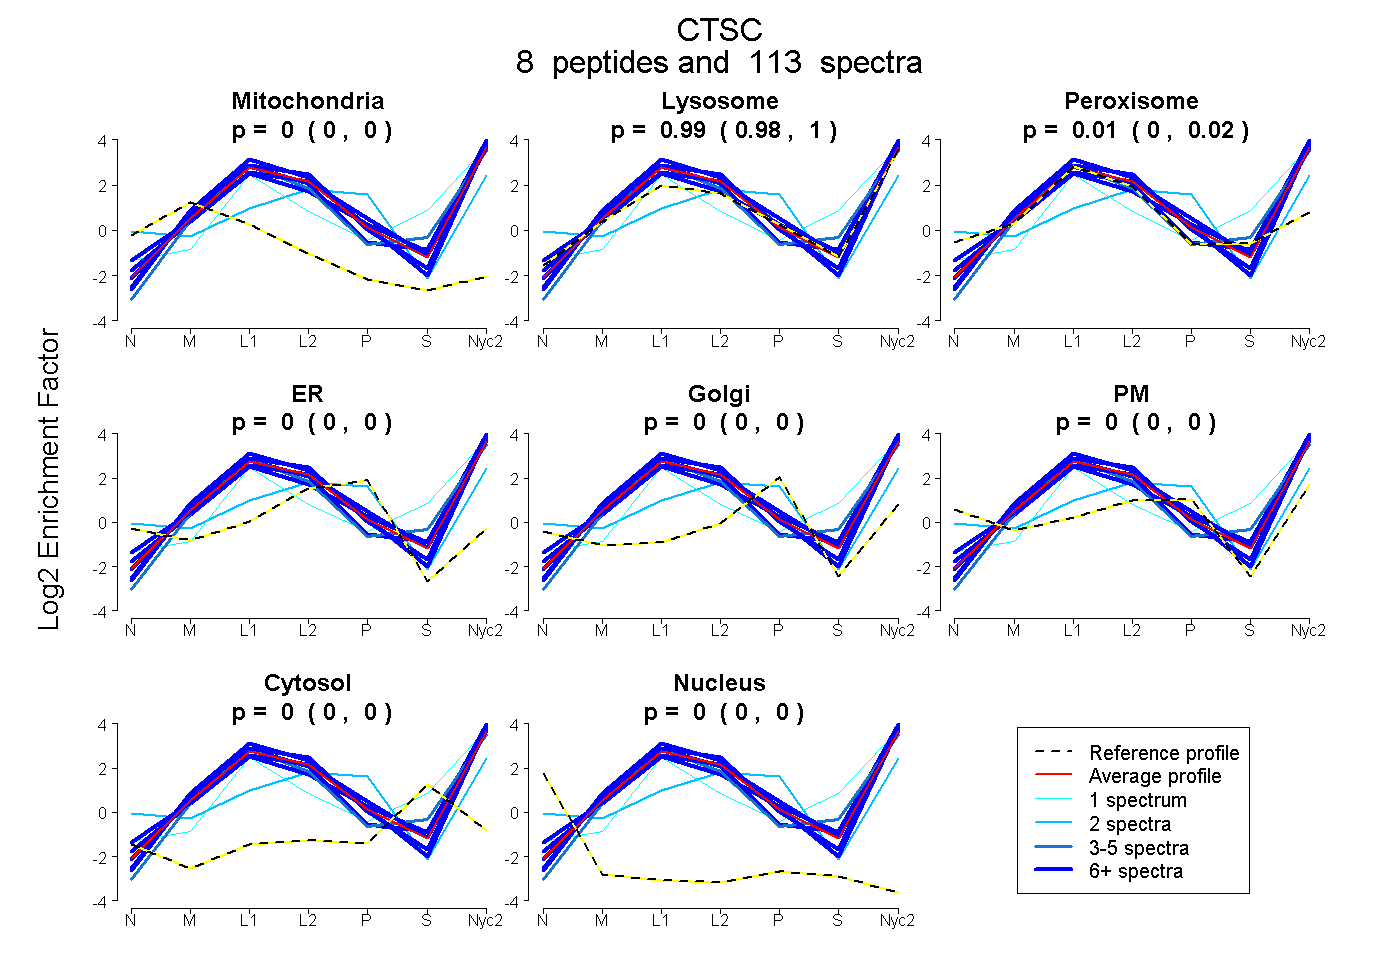
| Expt A |
8 peptides |
113 spectra |
|
0.000 0.000 | 0.000 |
0.989 0.978 | 0.997 |
0.011 0.001 | 0.020 |
0.000 0.000 | 0.000 |
0.000 0.000 | 0.000 |
0.000 0.000 | 0.000 |
0.000 0.000 | 0.000 |
0.000 0.000 | 0.000 |
| 8 spectra, NSWGSQWGESGYFR | 0.000 | 1.000 | 0.000 | 0.000 | 0.000 | 0.000 | 0.000 | 0.000 | ||
| 6 spectra, DPVTGLDYWIVK | 0.000 | 1.000 | 0.000 | 0.000 | 0.000 | 0.000 | 0.000 | 0.000 | ||
| 17 spectra, NWACFVGK | 0.000 | 0.971 | 0.029 | 0.000 | 0.000 | 0.000 | 0.000 | 0.000 | ||
| 4 spectra, NQESCGSCYSFASLGMLEAR | 0.000 | 0.936 | 0.064 | 0.000 | 0.000 | 0.000 | 0.000 | 0.000 | ||
| 1 spectrum, AISYCHETMTGWVHDVLGR | 0.000 | 0.830 | 0.000 | 0.000 | 0.000 | 0.000 | 0.170 | 0.000 | ||
| 2 spectra, AINSVQK | 0.000 | 0.353 | 0.000 | 0.146 | 0.000 | 0.501 | 0.000 | 0.000 | ||
| 30 spectra, VVIHLK | 0.000 | 1.000 | 0.000 | 0.000 | 0.000 | 0.000 | 0.000 | 0.000 | ||
| 45 spectra, GINFVSPVR | 0.000 | 0.987 | 0.013 | 0.000 | 0.000 | 0.000 | 0.000 | 0.000 |
| Plot | Mito | Lyso or Perox | ER | Golgi | PM | Cytosol | Nucleus | ||||||
| Expt B |
4 peptides |
66 spectra |
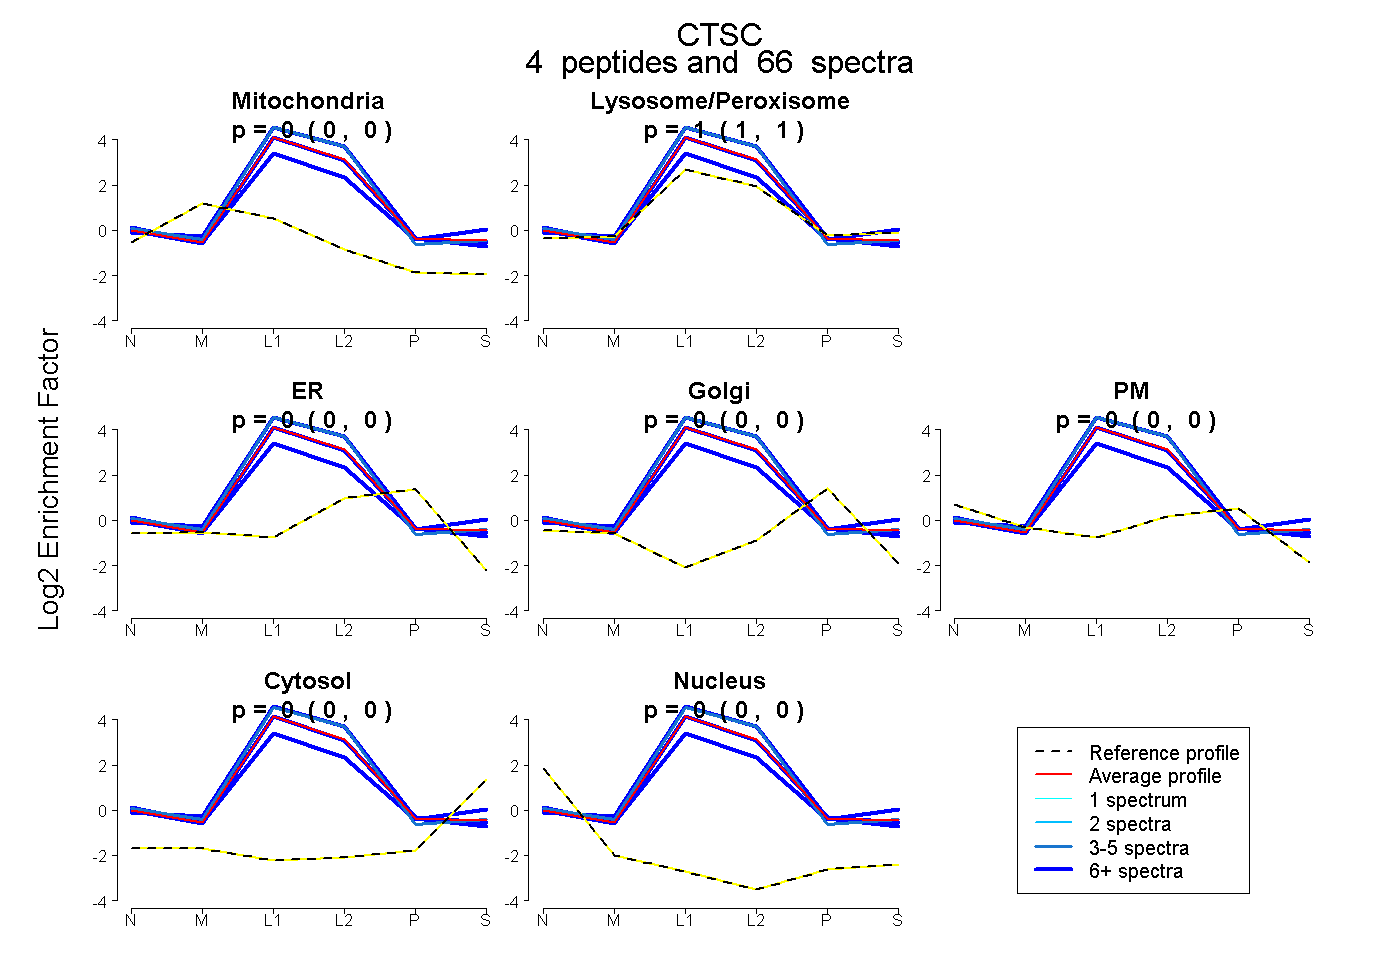 |
0.000 0.000 | 0.000 |
1.000 1.000 | 1.000 |
0.000 0.000 | 0.000 |
0.000 0.000 | 0.000 |
0.000 0.000 | 0.000 |
0.000 0.000 | 0.000 |
0.000 0.000 | 0.000 |
|||
| Plot | Lyso | Other | |||||||||||
| Expt C |
11 peptides |
446 spectra |
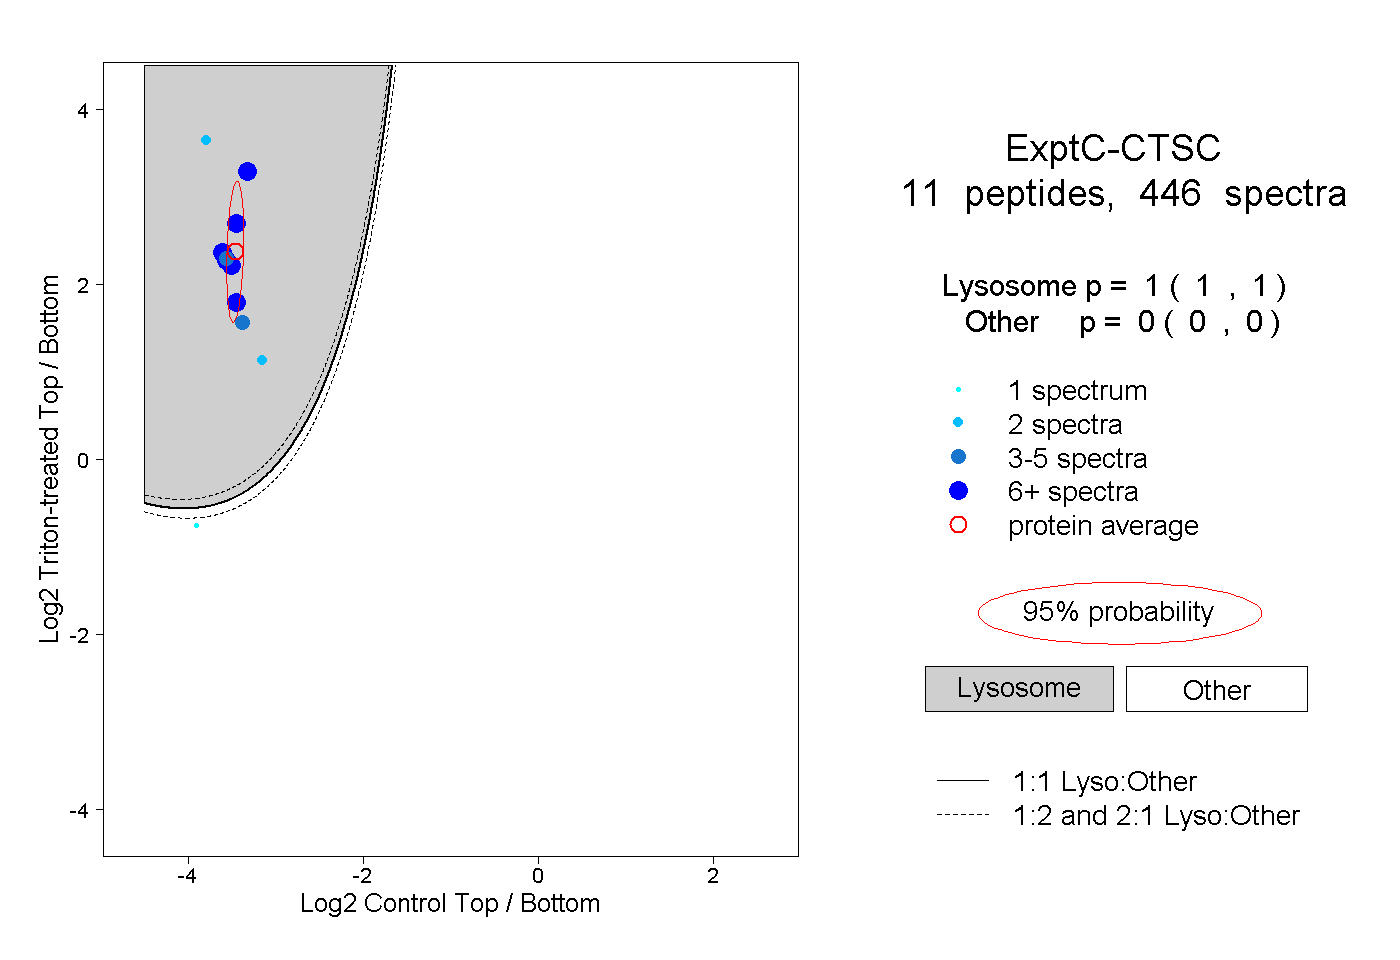 |
1.000 1.000 | 1.000 |
0.000 0.000 | 0.000 |
||||||||
| Plot | Lyso | Other | |||||||||||
| Expt D |
4 peptides |
23 spectra |
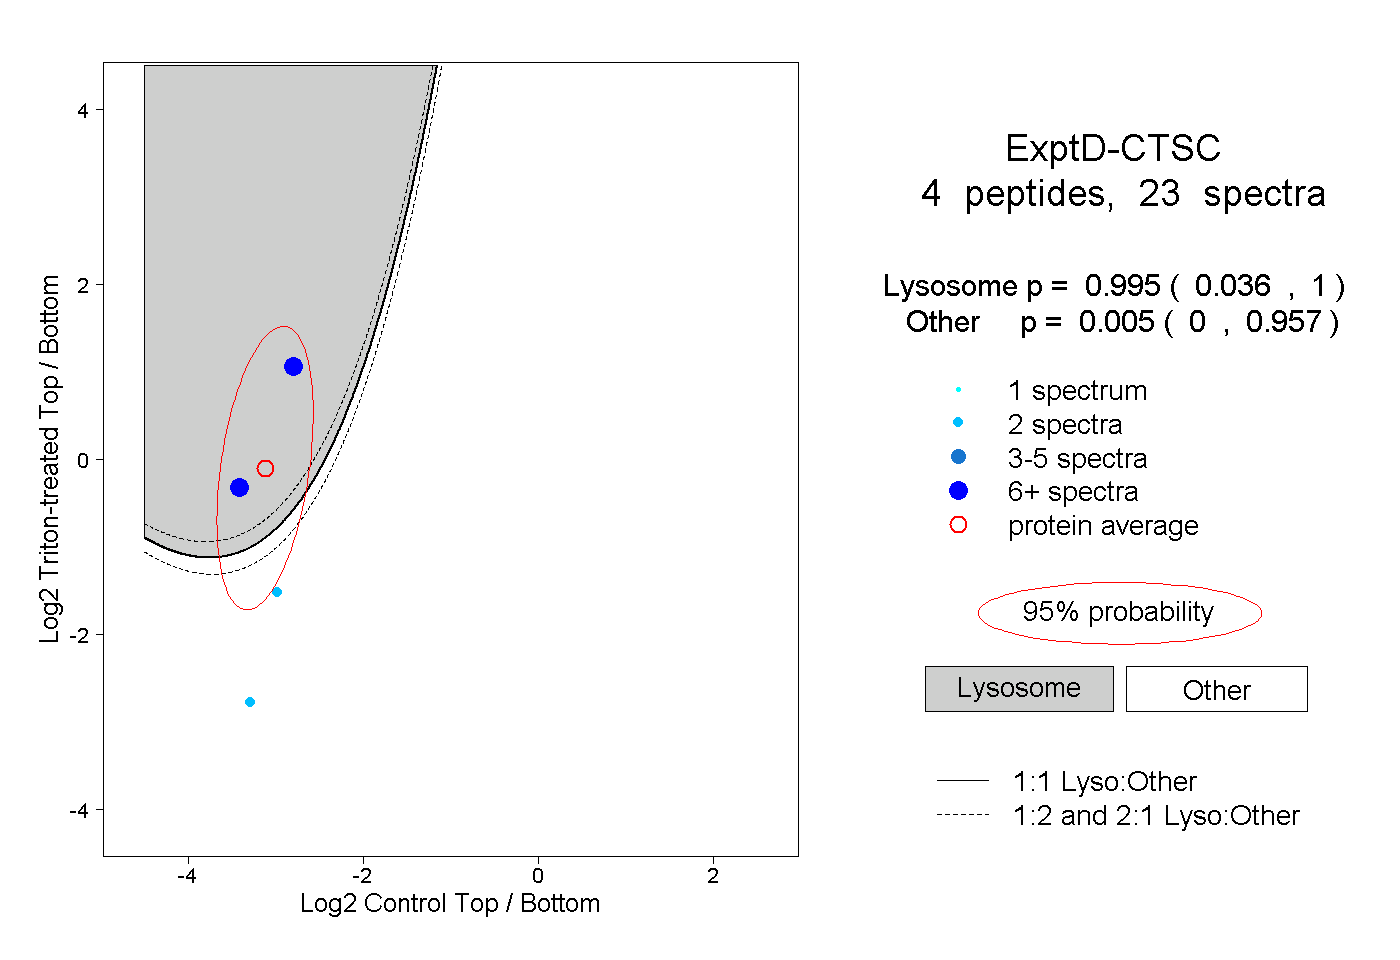 |
0.995 0.036 | 1.000 |
0.005 0.000 | 0.957 |