 21
21peptides
spectra
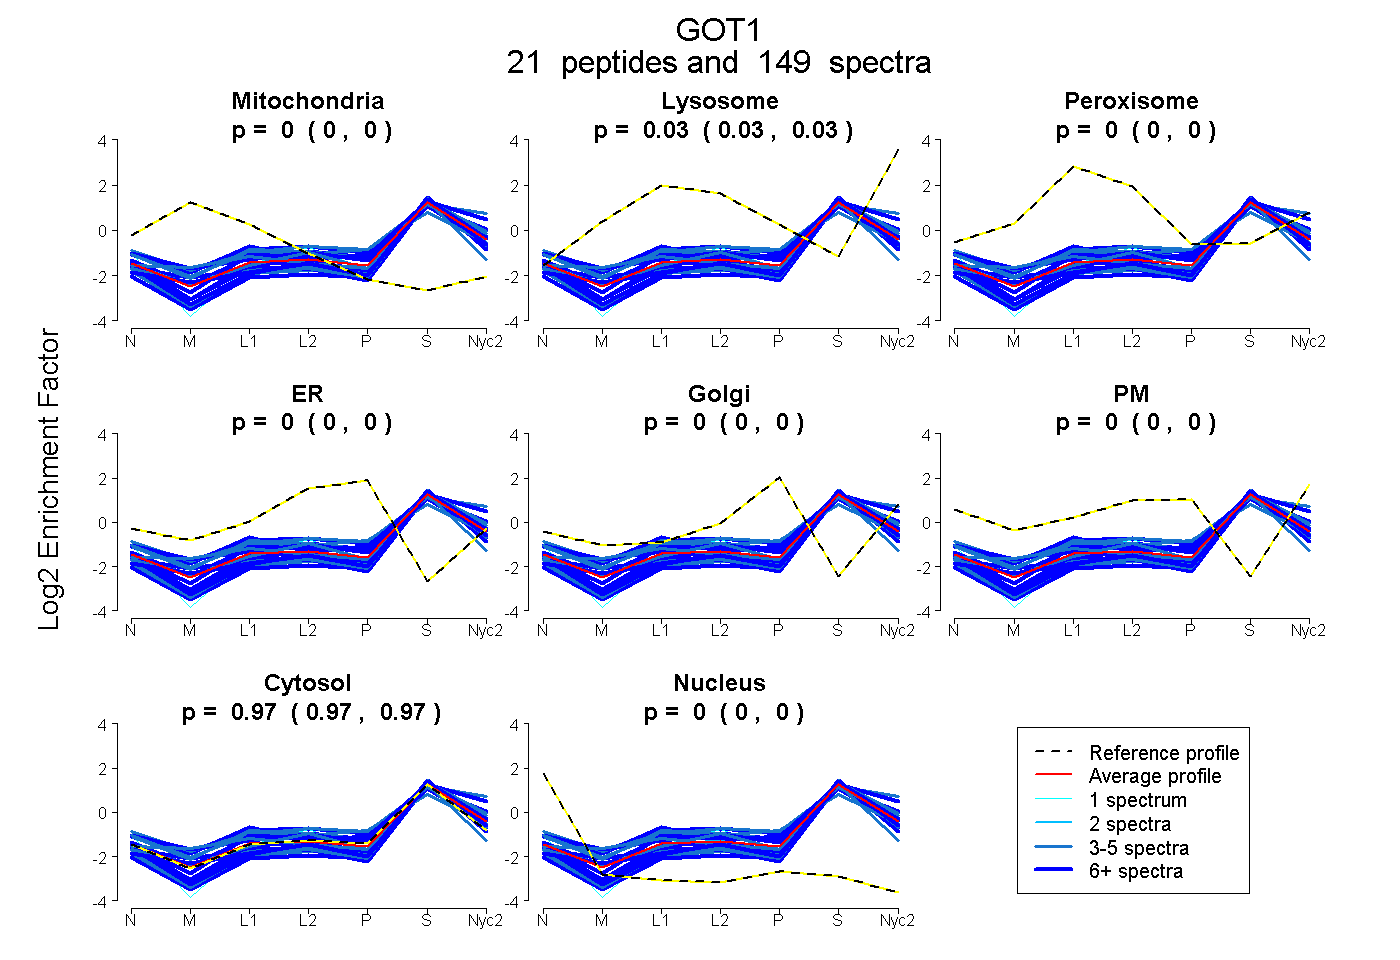
0.000 | 0.000
0.030 | 0.034
0.000 | 0.000
0.000 | 0.000
0.000 | 0.000
0.000 | 0.000
0.966 | 0.970
0.000 | 0.000
16peptides
spectra
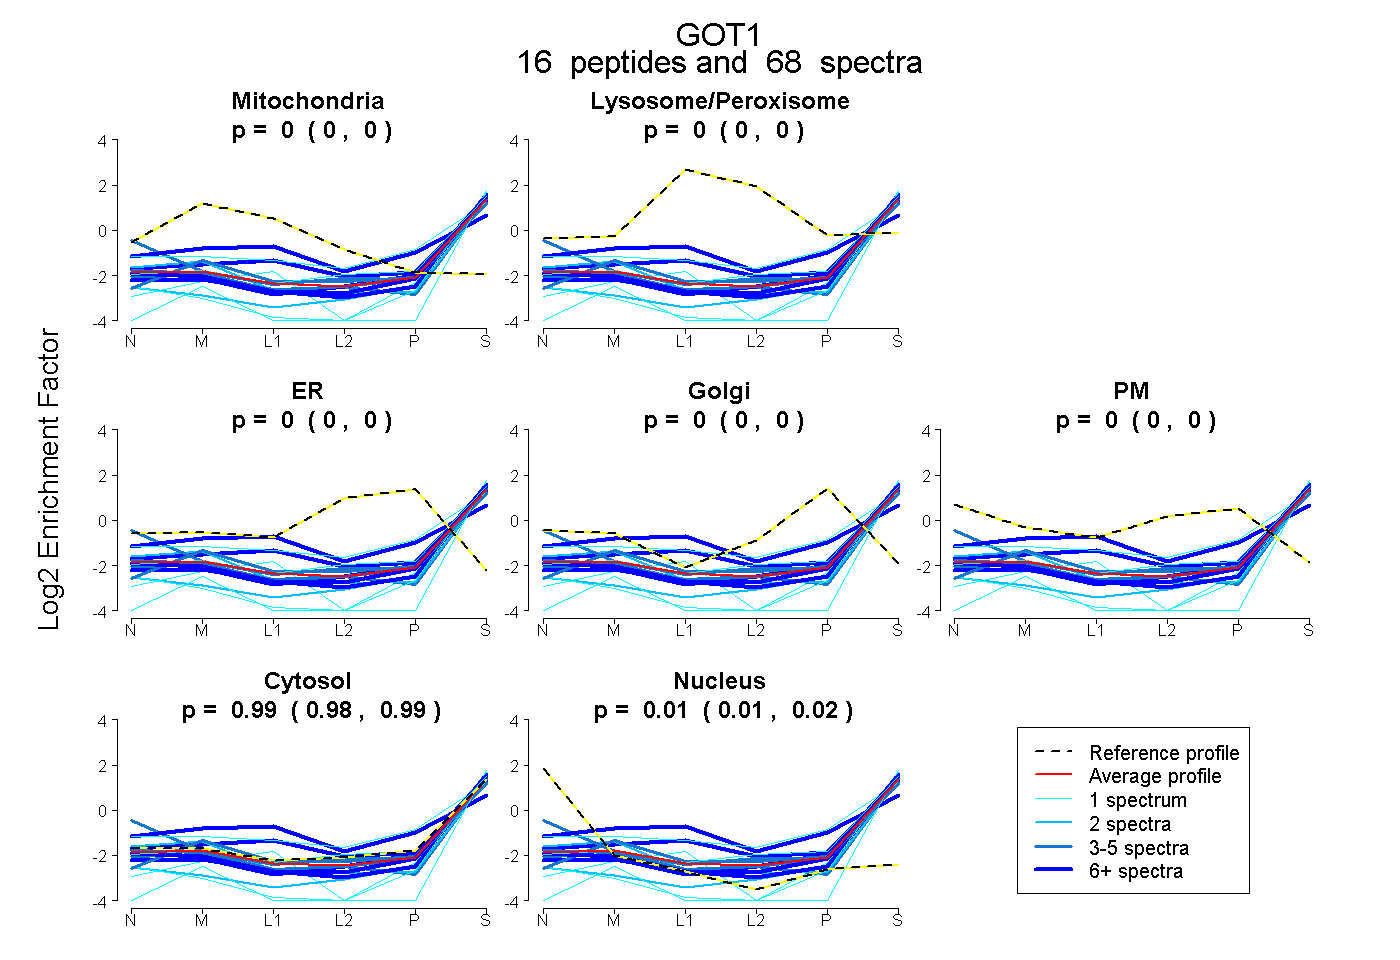
0.000 | 0.000
0.000 | 0.000
0.000 | 0.000
0.000 | 0.000
0.000 | 0.000
0.981 | 0.991
0.008 | 0.018
17peptides
spectra
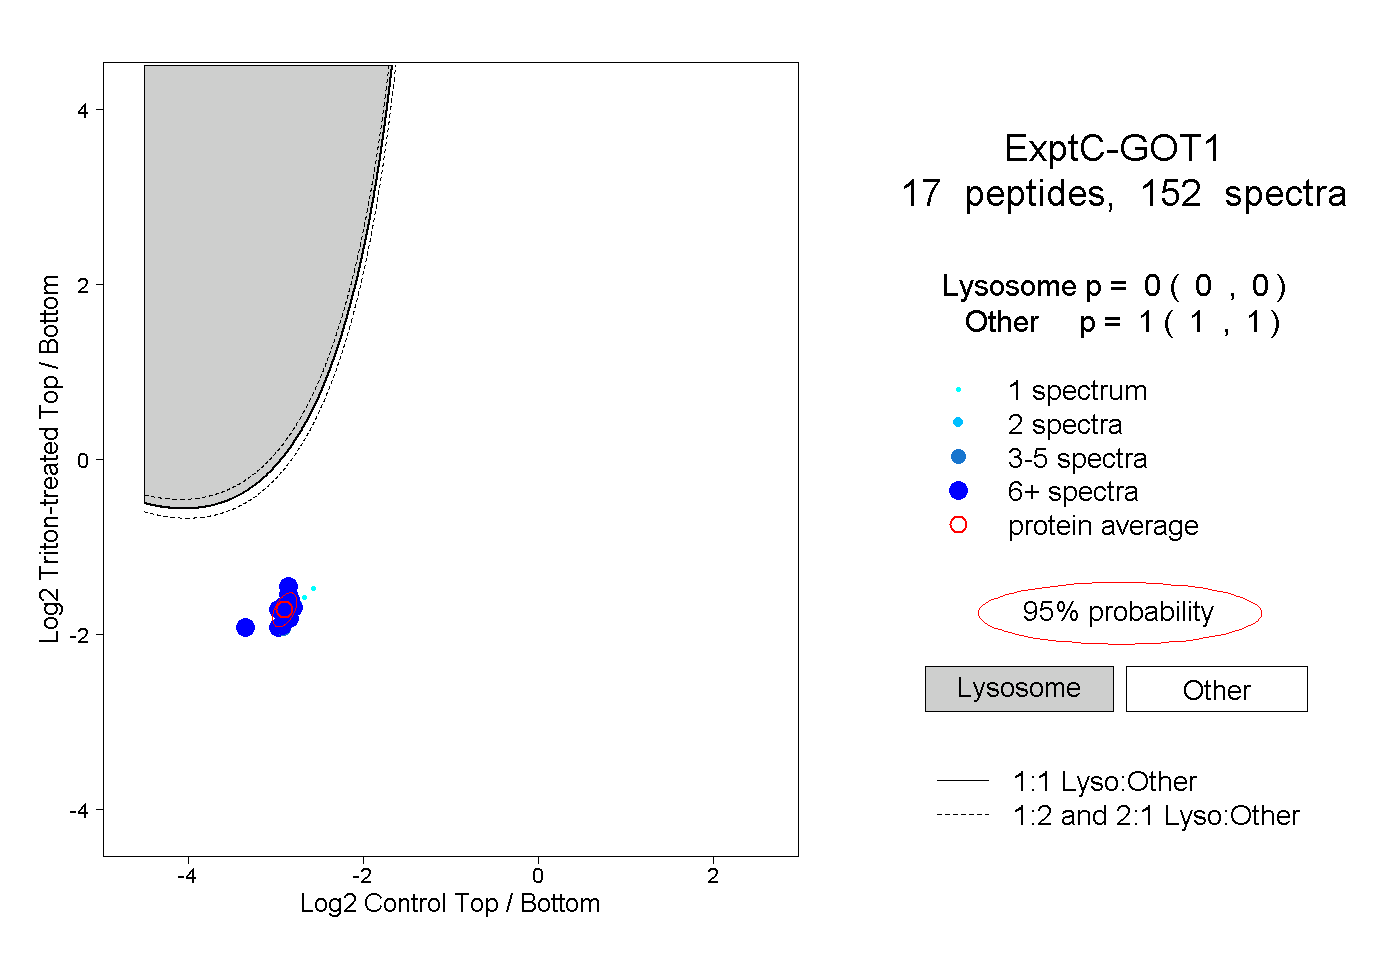
0.000 | 0.000
1.000 | 1.000
9peptides
spectra
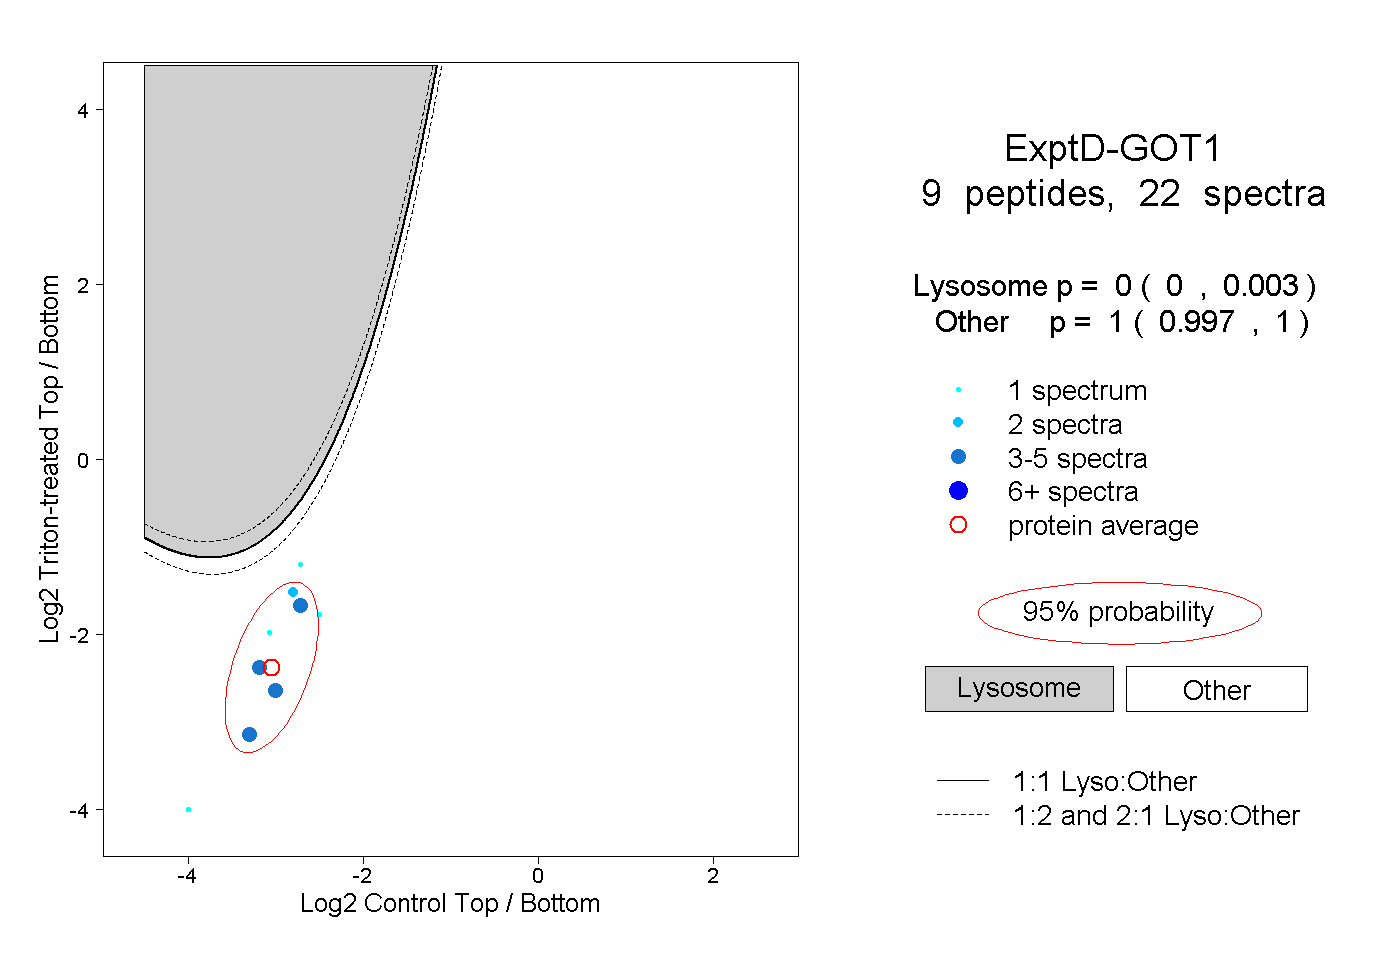
0.000 | 0.003
0.997 | 1.000