 2
2peptides
spectra
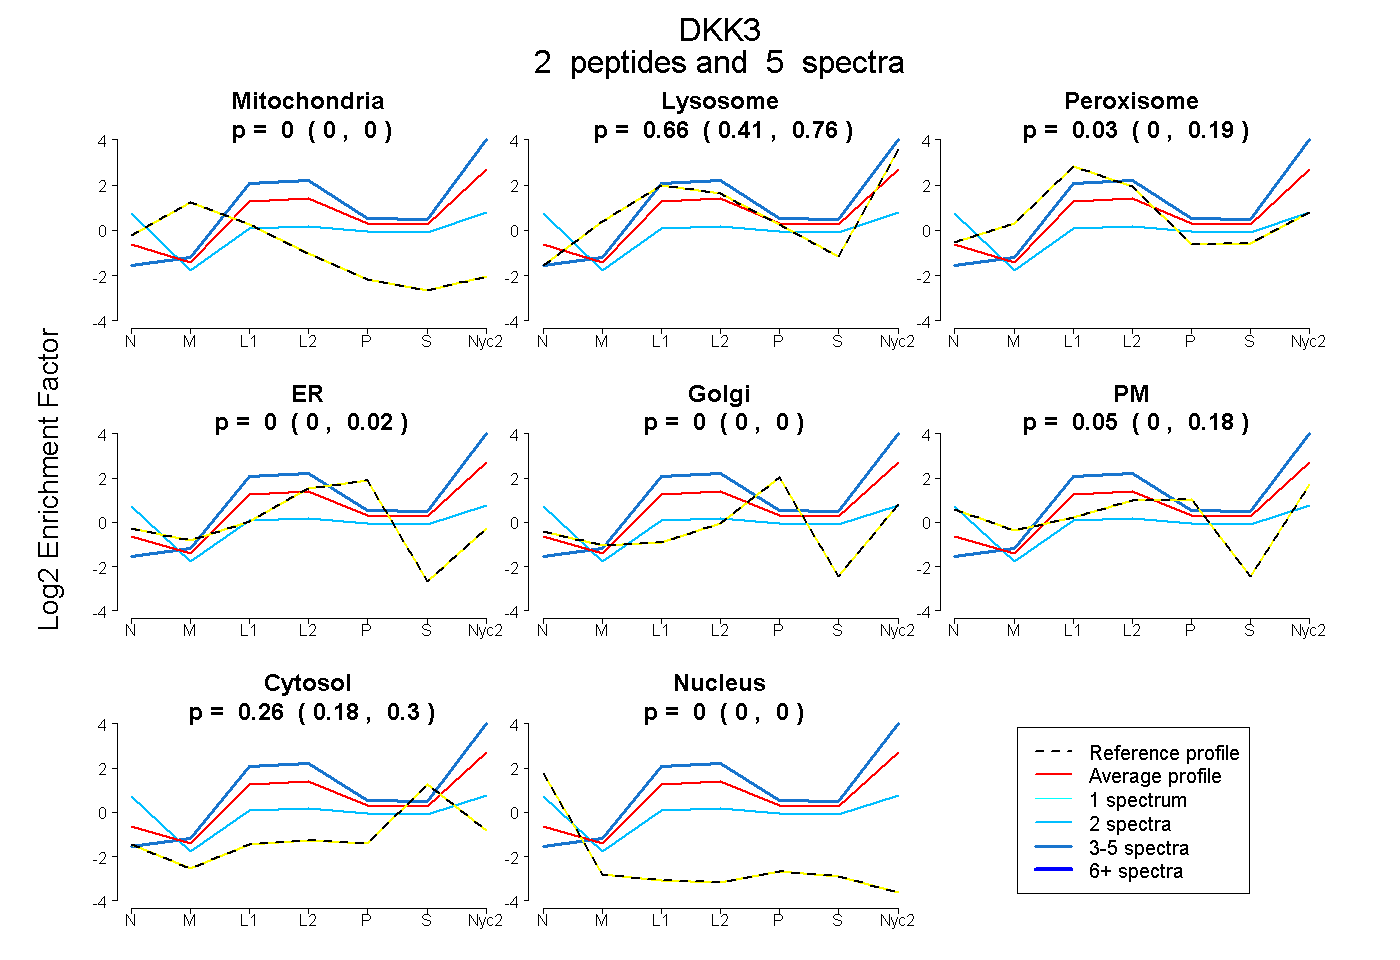
0.000 | 0.000
0.411 | 0.763
0.000 | 0.189
0.000 | 0.023
0.000 | 0.000
0.000 | 0.181
0.177 | 0.303
0.000 | 0.000
1peptide
spectra
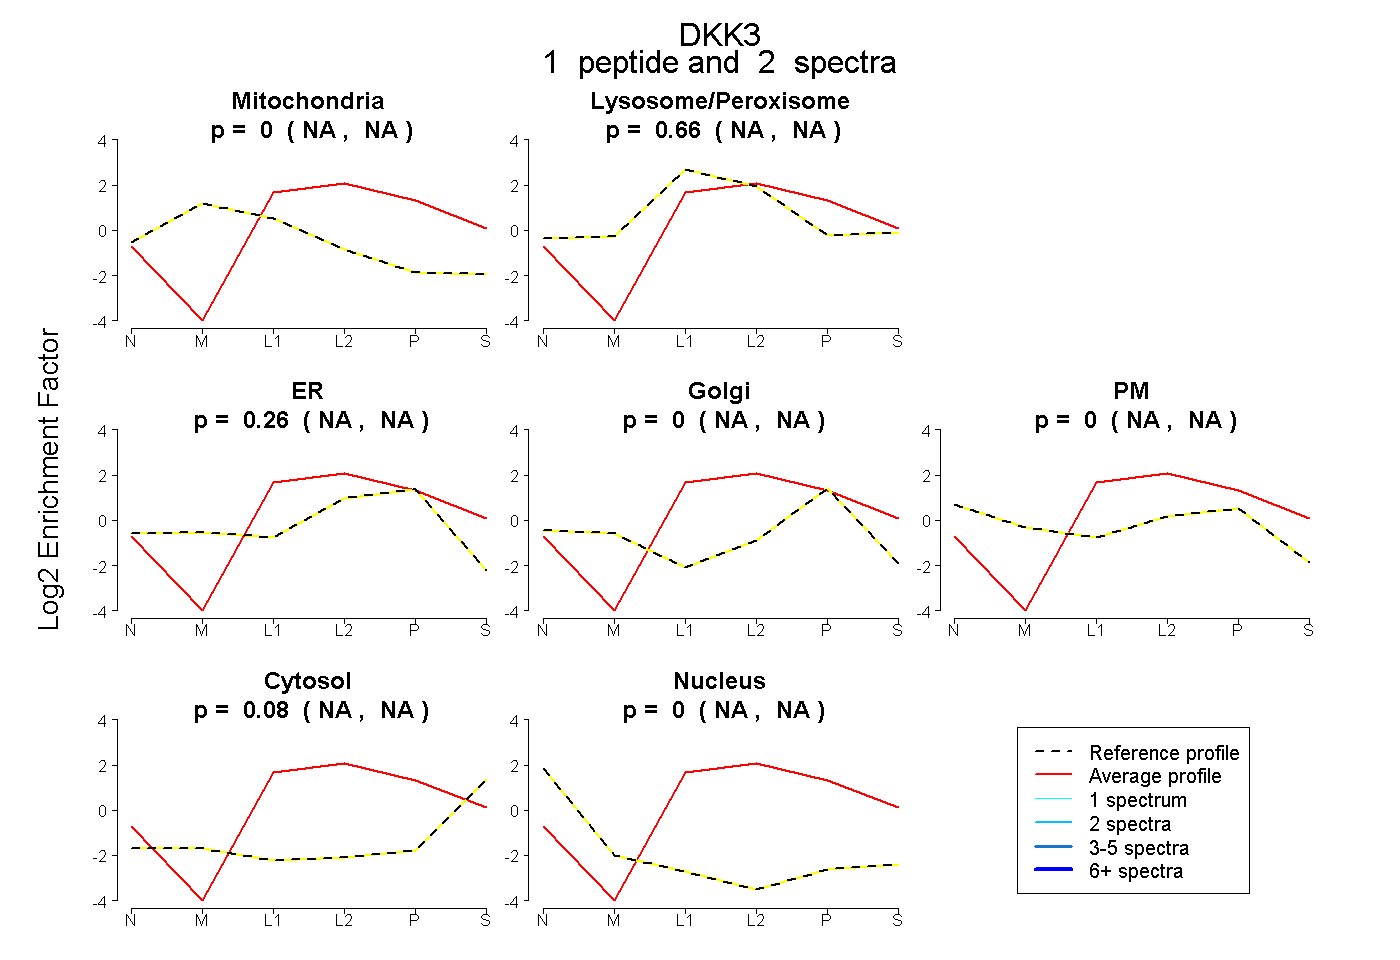
NA | NA
NA | NA
NA | NA
NA | NA
NA | NA
NA | NA
NA | NA
4peptides
spectra
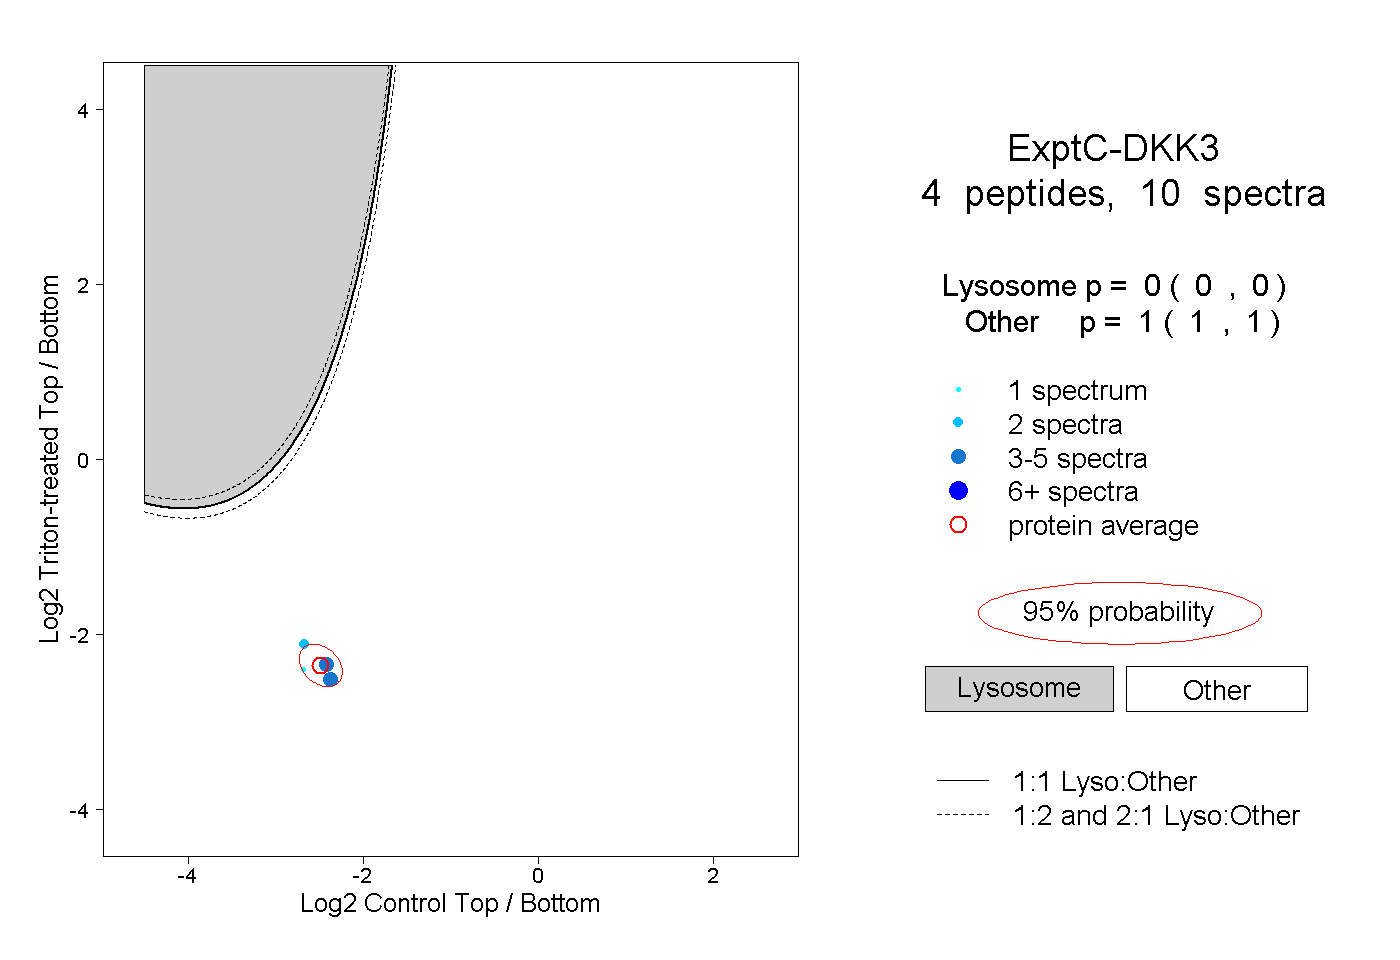
0.000 | 0.000
1.000 | 1.000
1peptide
spectra
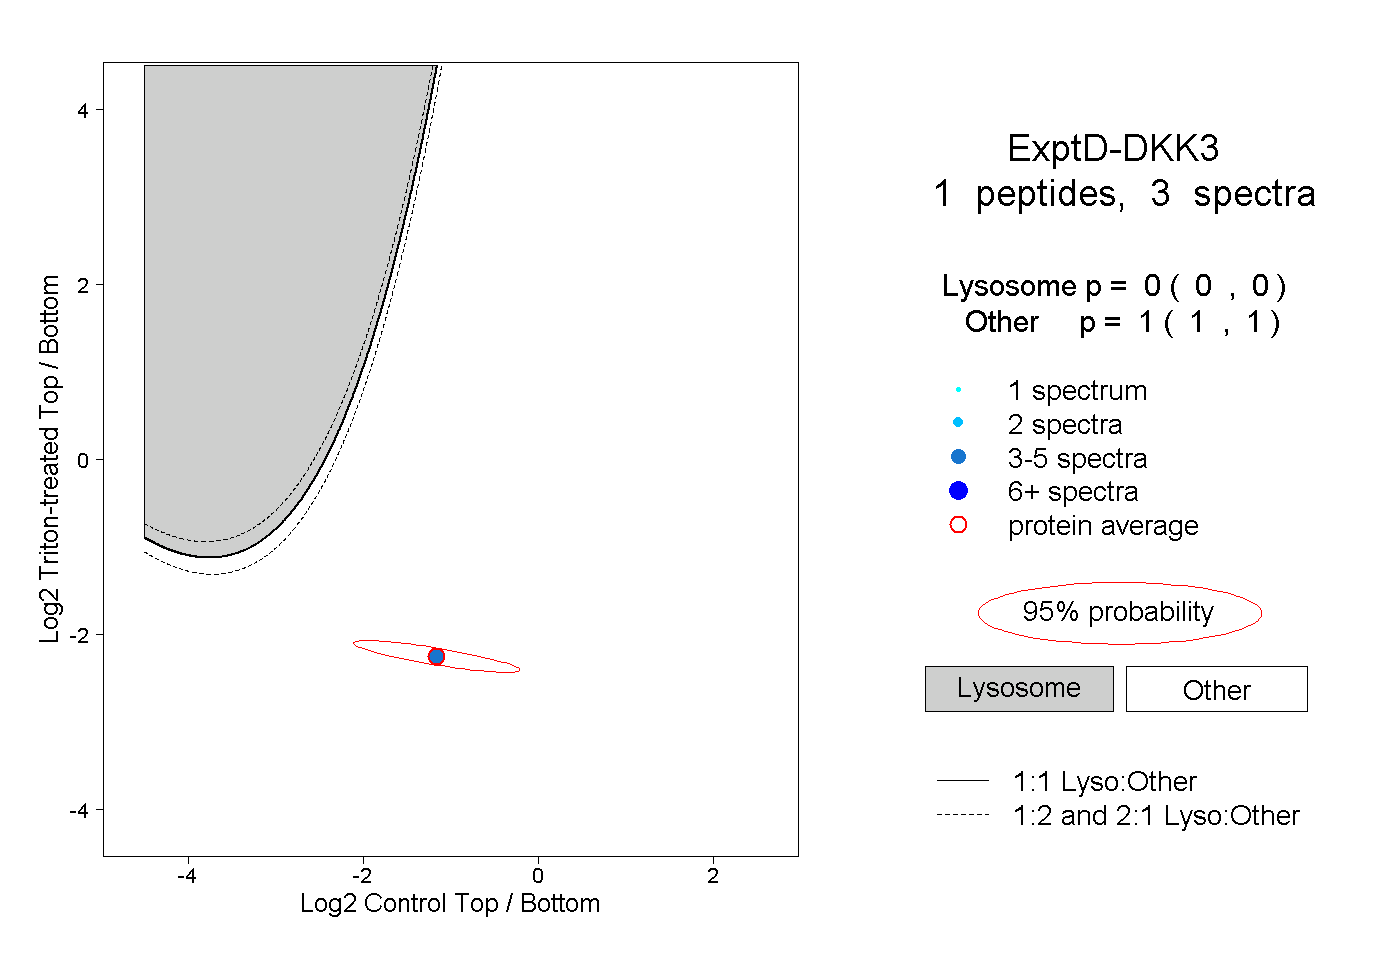
0.000 | 0.000
1.000 | 1.000