 9
9peptides
spectra
0.000 | 0.000
0.096 | 0.120
0.000 | 0.000
0.000 | 0.000
0.033 | 0.057
0.000 | 0.000
0.834 | 0.855
0.000 | 0.000
10peptides
spectra
0.000 | 0.000
1.000 | 1.000
| Plot | Mito | Lyso | Perox | ER | Golgi | PM | Cytosol | Nucleus | |||||
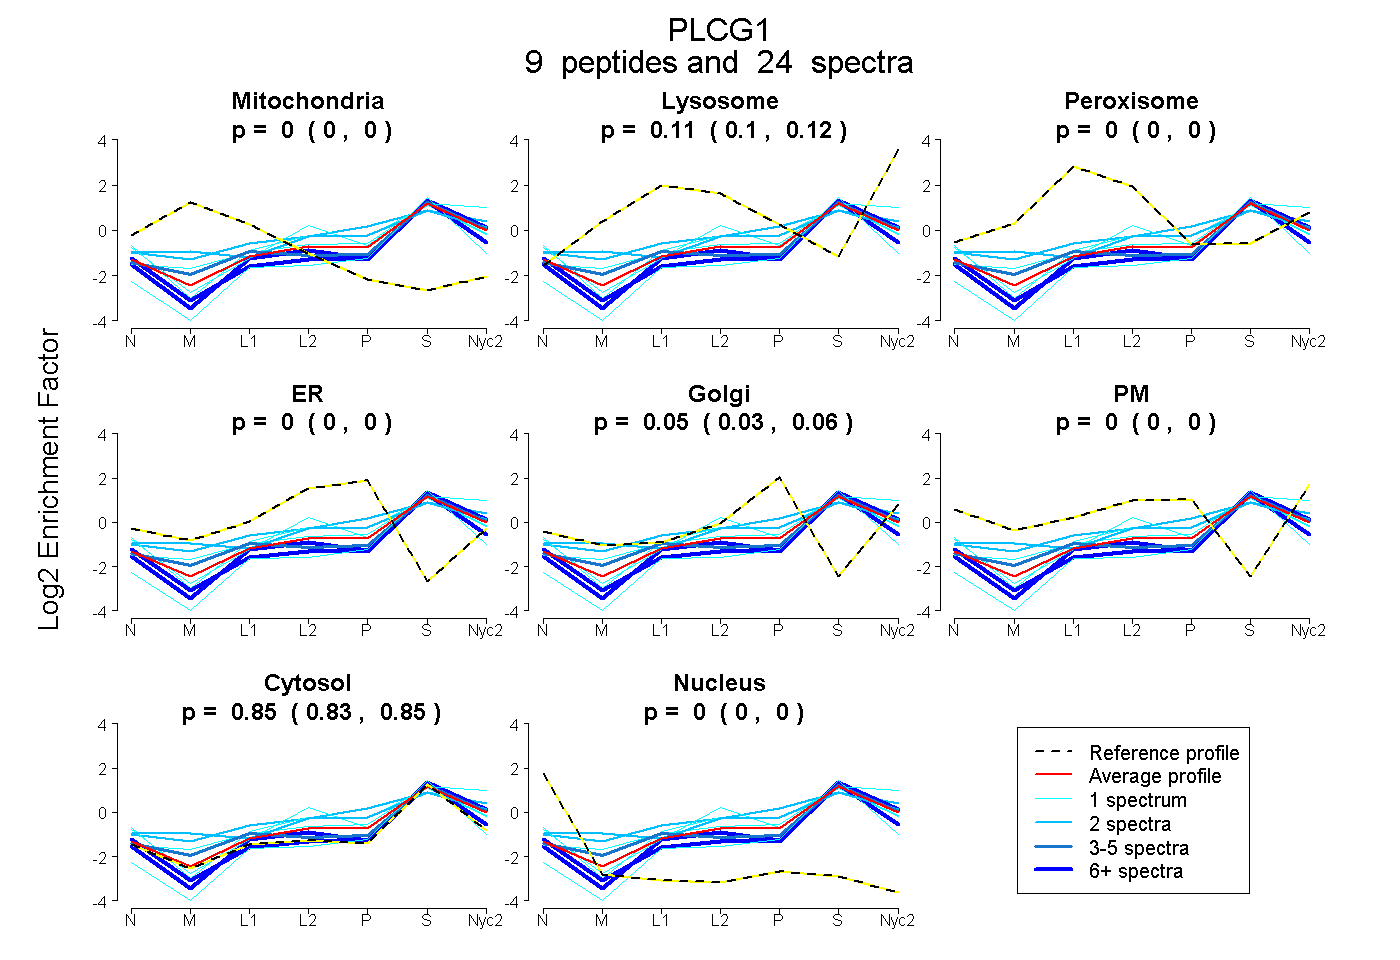
| Expt A |
9 peptides |
24 spectra |
|
0.000 0.000 | 0.000 |
0.109 0.096 | 0.120 |
0.000 0.000 | 0.000 |
0.000 0.000 | 0.000 |
0.046 0.033 | 0.057 |
0.000 0.000 | 0.000 |
0.845 0.834 | 0.855 |
0.000 0.000 | 0.000 |
||
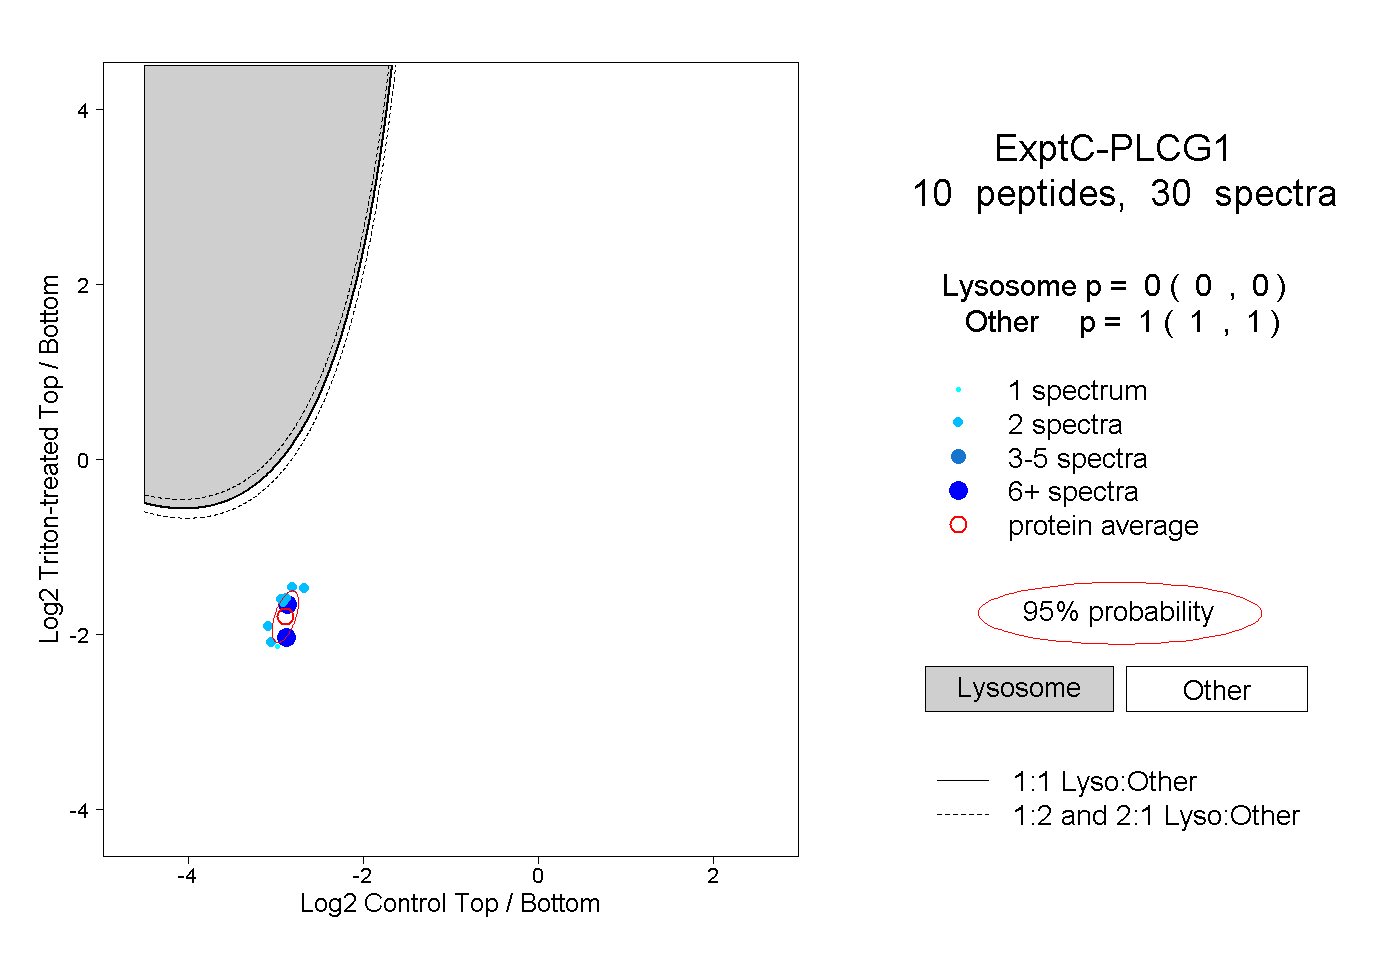
| Plot | Lyso | Other | |||||||||||
| Expt C |
10 peptides |
30 spectra |
|
0.000 0.000 | 0.000 |
1.000 1.000 | 1.000 |