 17
17peptides
spectra
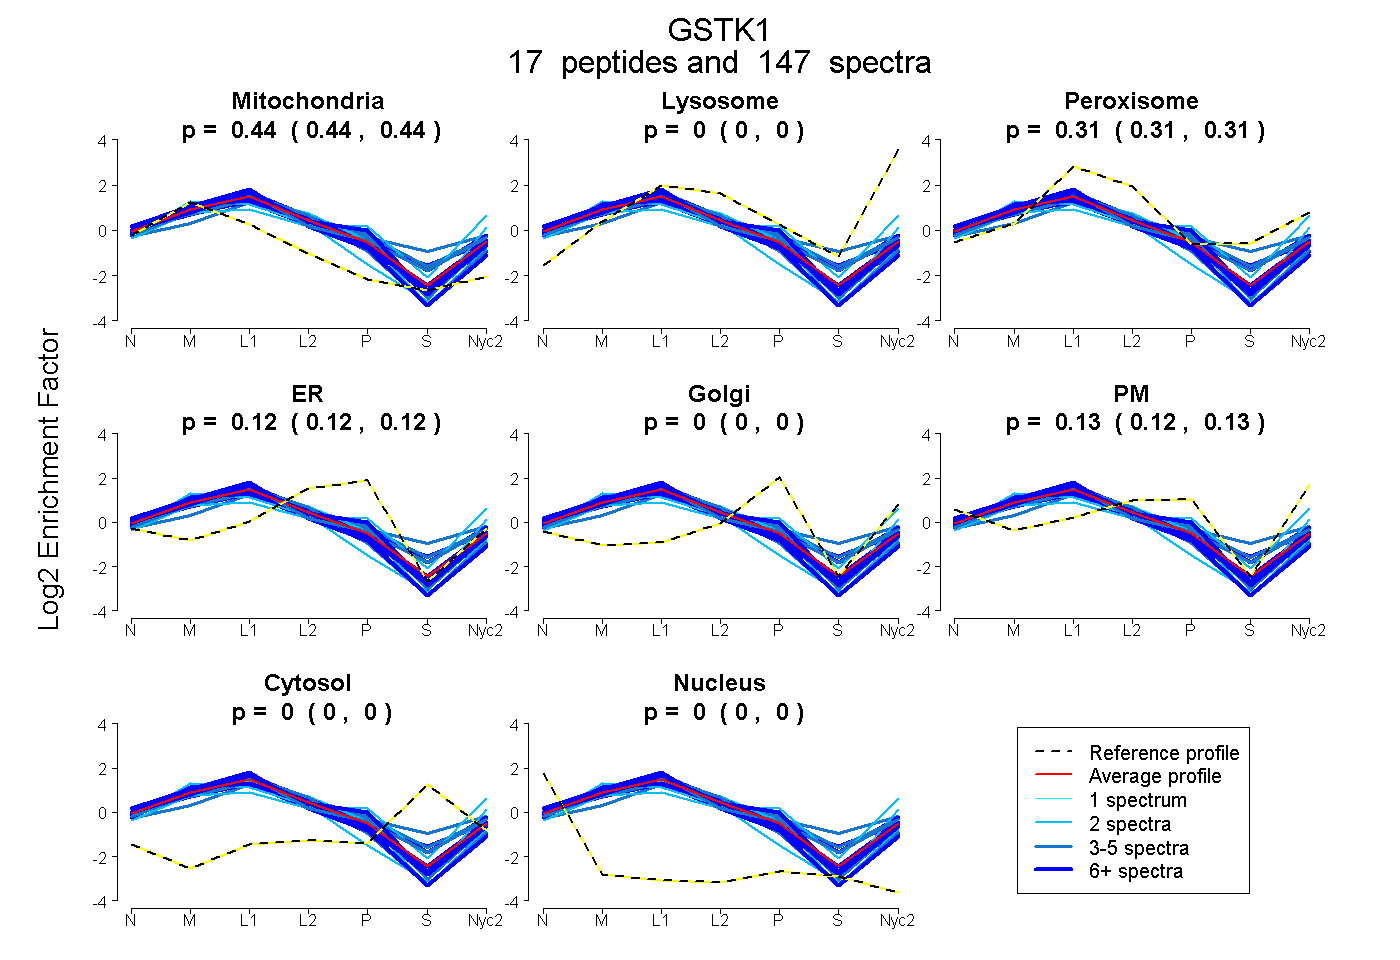
0.438 | 0.443
0.000 | 0.000
0.306 | 0.314
0.115 | 0.124
0.000 | 0.000
0.124 | 0.133
0.000 | 0.000
0.000 | 0.000
14peptides
spectra
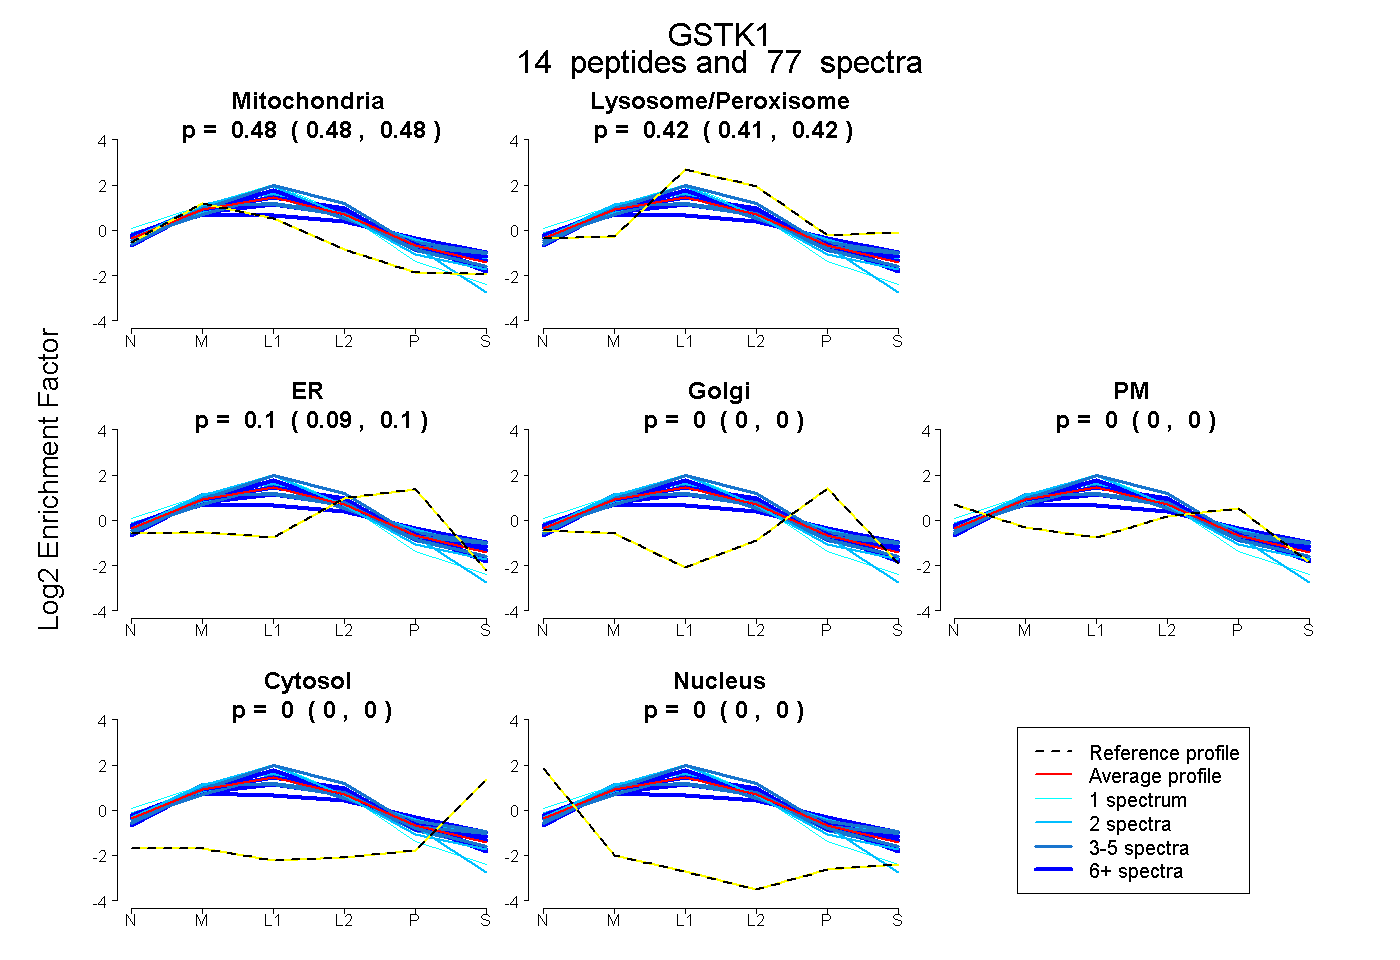
0.479 | 0.485
0.414 | 0.425
0.093 | 0.102
0.000 | 0.000
0.000 | 0.000
0.000 | 0.000
0.000 | 0.000
17peptides
spectra
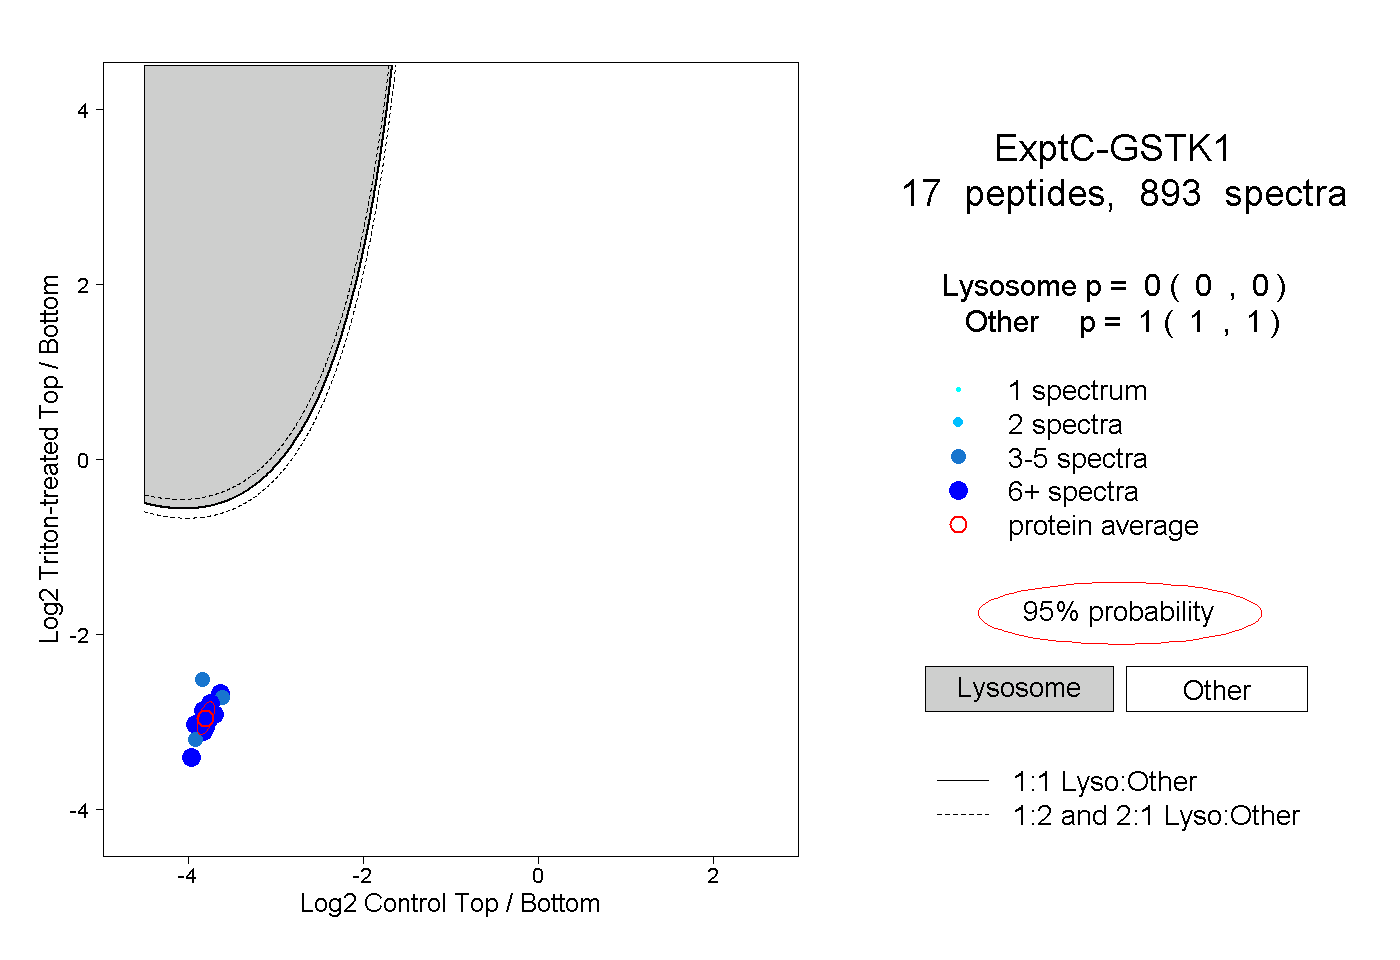
0.000 | 0.000
1.000 | 1.000
9peptides
spectra
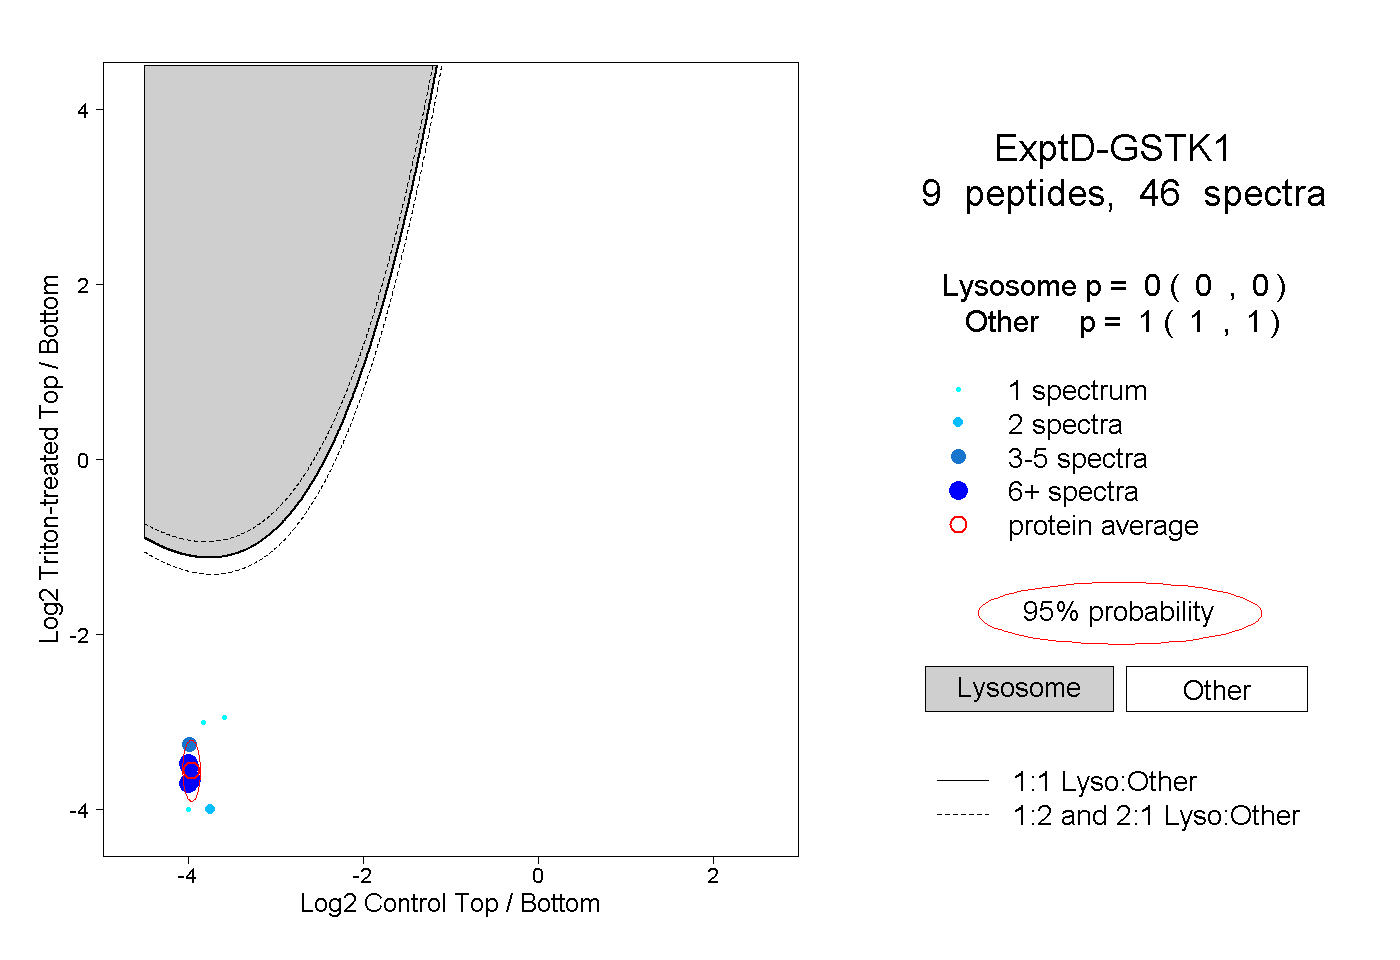
0.000 | 0.000
1.000 | 1.000