 3
3peptides
spectra
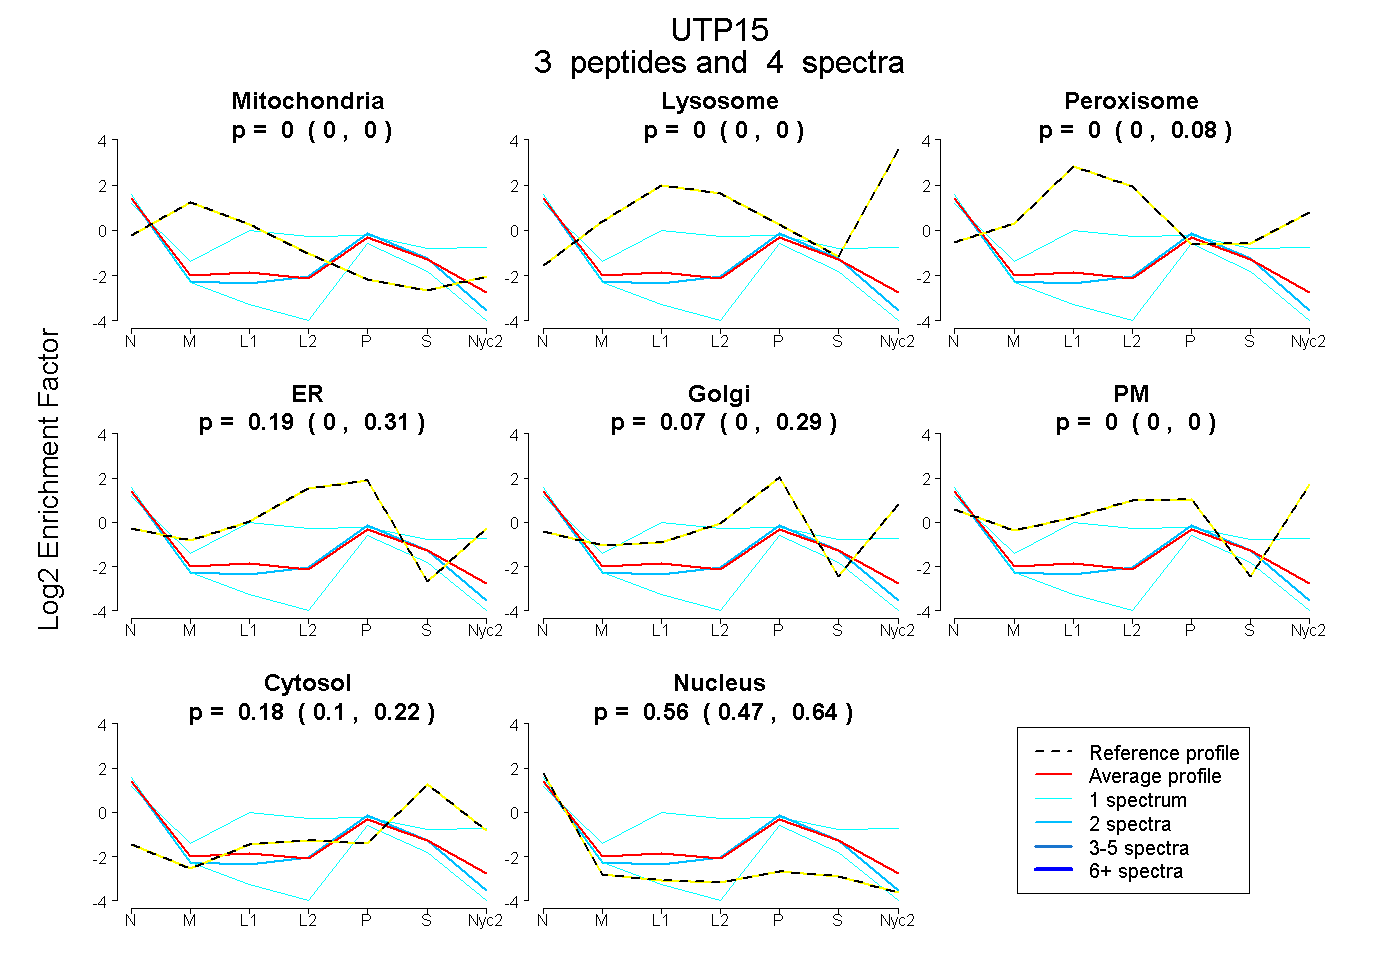
0.000 | 0.005
0.000 | 0.000
0.000 | 0.078
0.000 | 0.308
0.000 | 0.292
0.000 | 0.000
0.096 | 0.215
0.471 | 0.644
| Plot | Mito | Lyso | Perox | ER | Golgi | PM | Cytosol | Nucleus | |||||
| Expt A |
3 peptides |
4 spectra |
|
0.000 0.000 | 0.005 |
0.000 0.000 | 0.000 |
0.000 0.000 | 0.078 |
0.189 0.000 | 0.308 |
0.073 0.000 | 0.292 |
0.000 0.000 | 0.000 |
0.177 0.096 | 0.215 |
0.561 0.471 | 0.644 |
| 1 spectrum, TVTCLCLSSSGQR | 0.000 | 0.000 | 0.000 | 0.000 | 0.082 | 0.000 | 0.042 | 0.876 | ||
| 2 spectra, HLEWYDR | 0.000 | 0.000 | 0.000 | 0.219 | 0.000 | 0.000 | 0.153 | 0.628 | ||
| 1 spectrum, EHSDYVR | 0.000 | 0.000 | 0.278 | 0.037 | 0.000 | 0.250 | 0.161 | 0.273 |