 11
11peptides
spectra
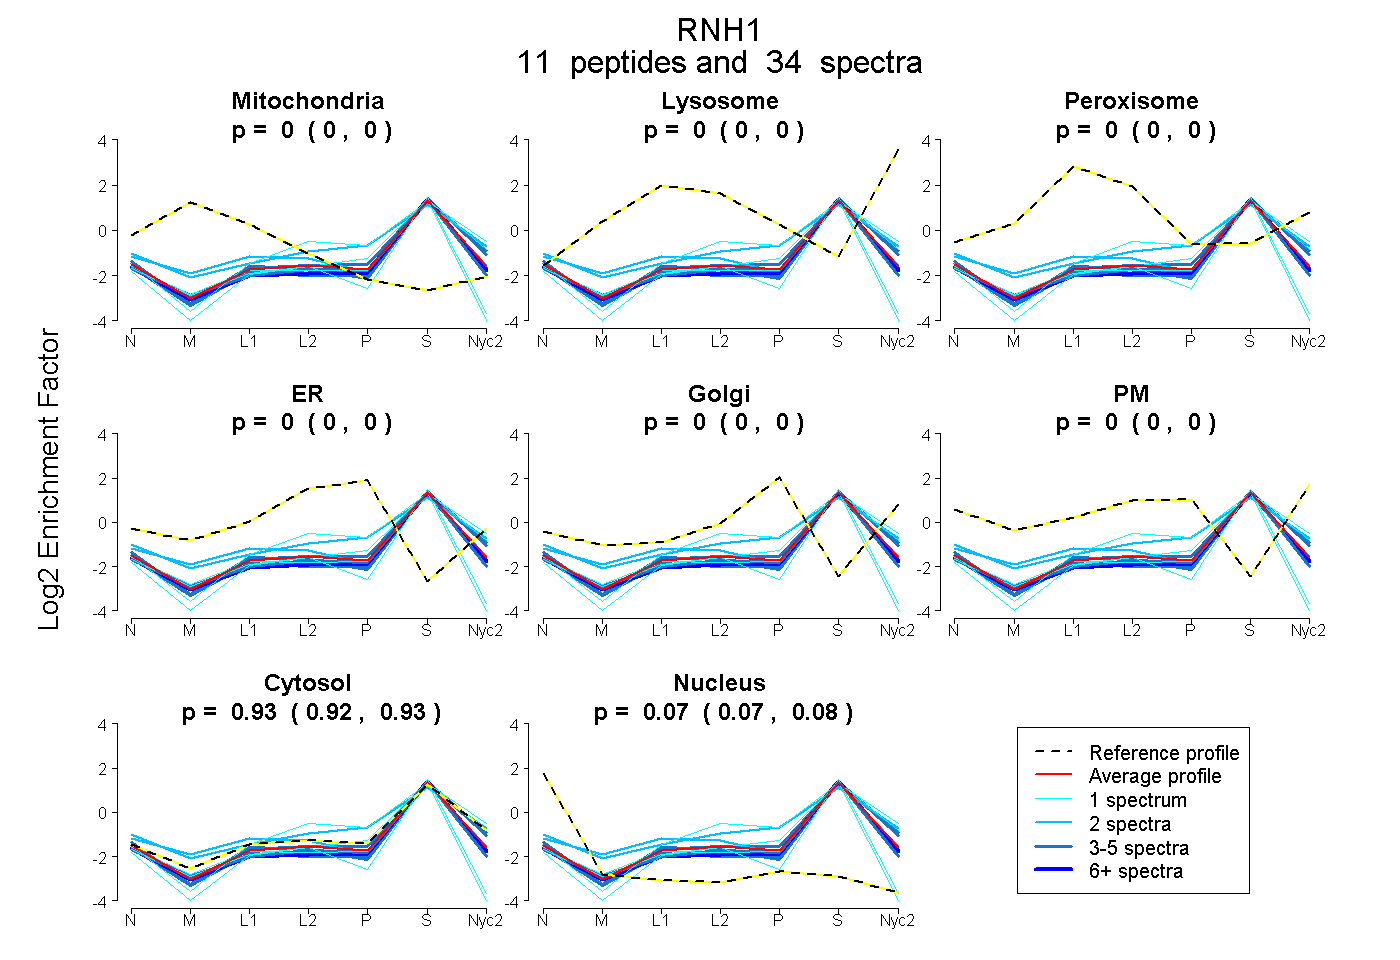
0.000 | 0.000
0.000 | 0.000
0.000 | 0.000
0.000 | 0.000
0.000 | 0.000
0.000 | 0.000
0.923 | 0.934
0.065 | 0.077
7peptides
spectra
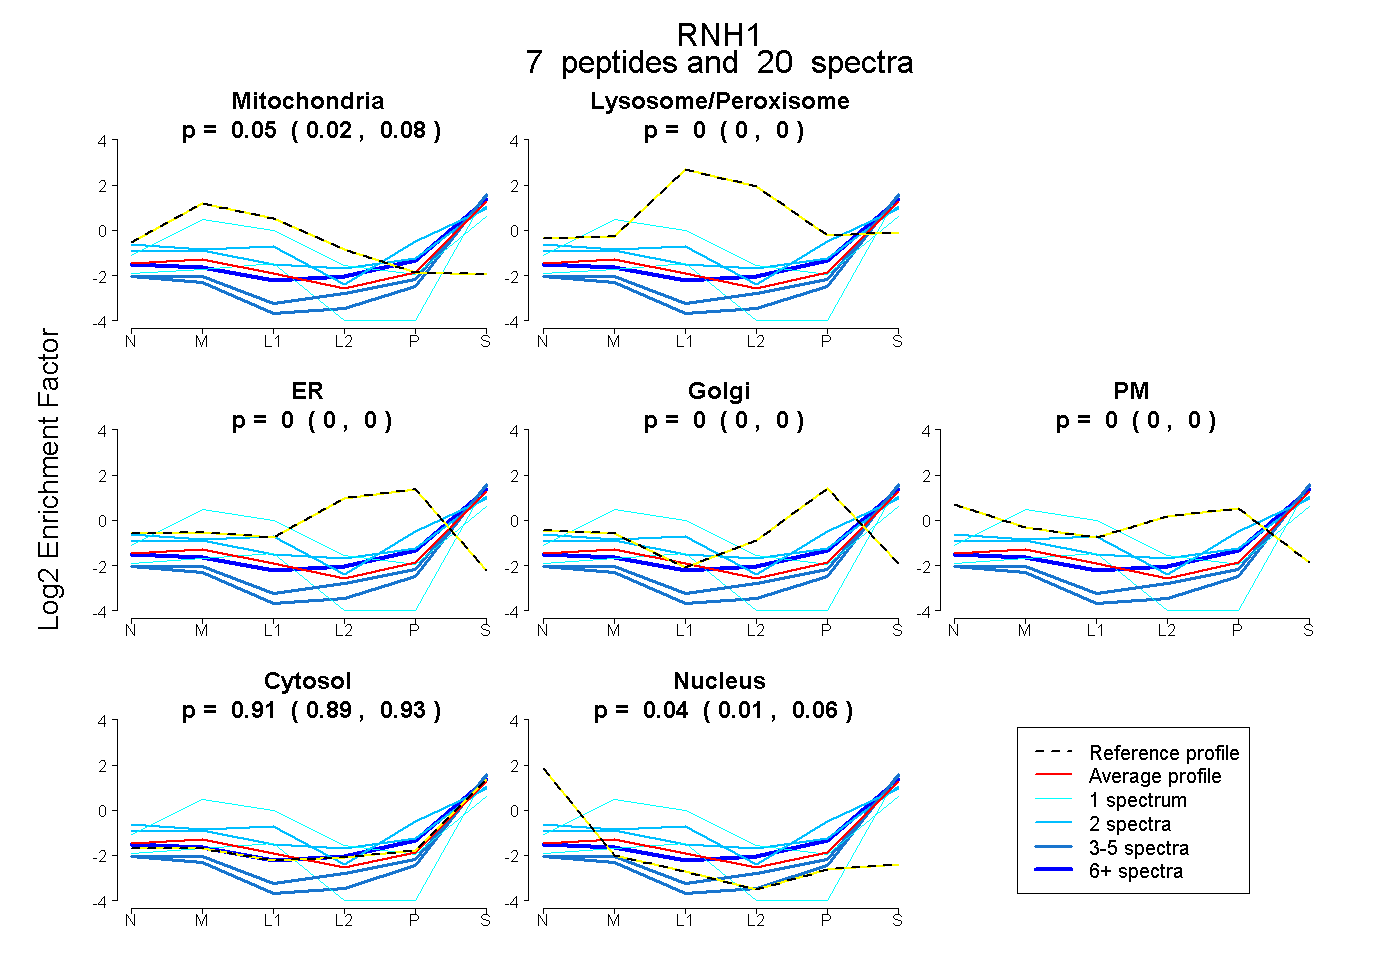
0.017 | 0.079
0.000 | 0.000
0.000 | 0.000
0.000 | 0.000
0.000 | 0.000
0.894 | 0.932
0.009 | 0.057
11peptides
spectra
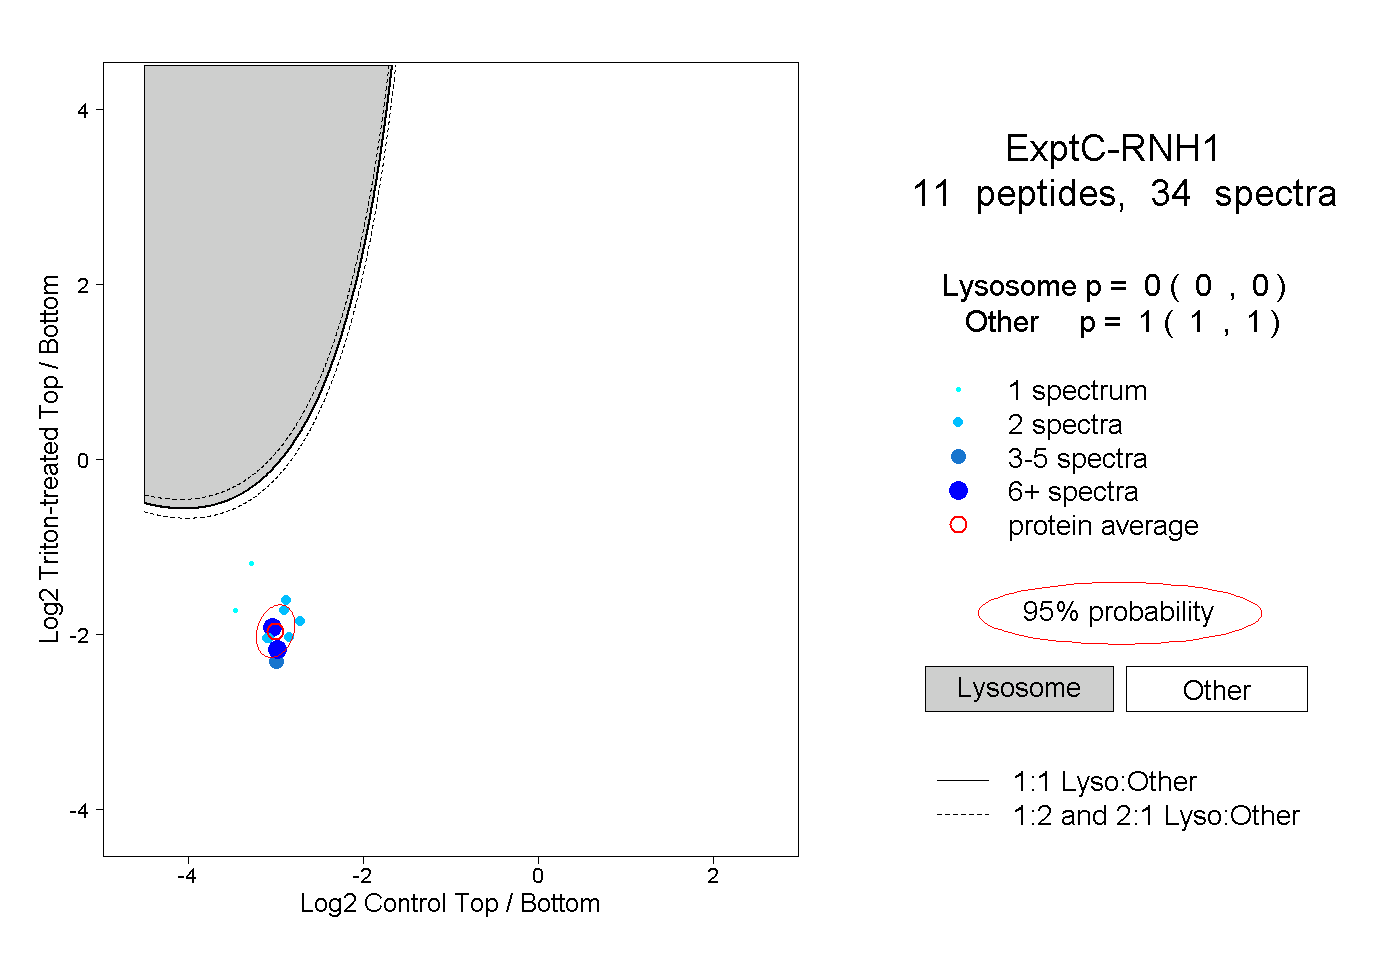
0.000 | 0.000
1.000 | 1.000
3peptides
spectra
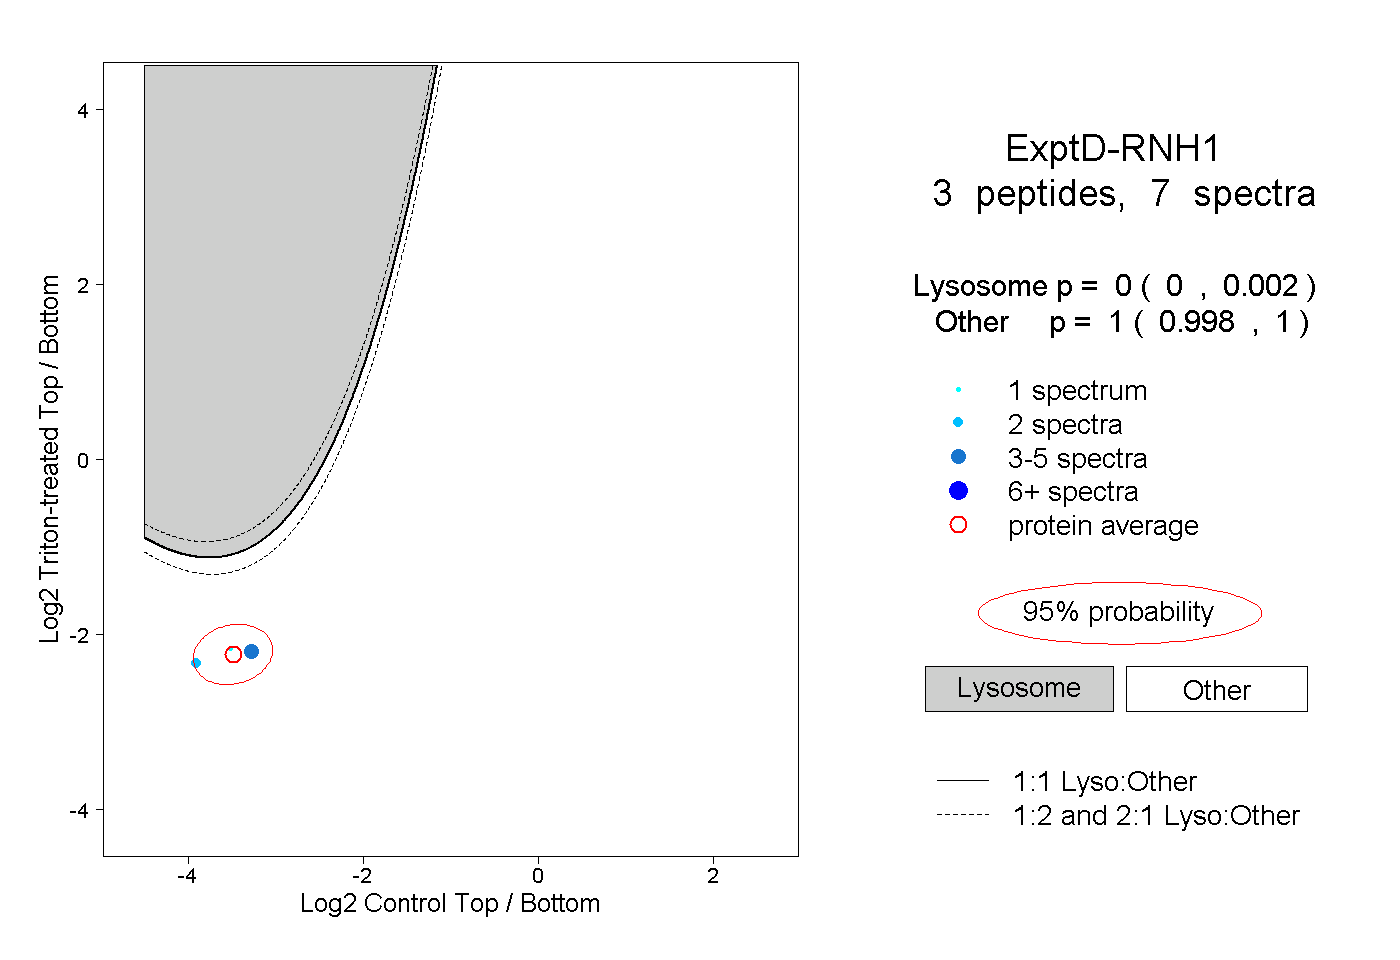
0.000 | 0.002
0.998 | 1.000