 3
3peptides
spectra
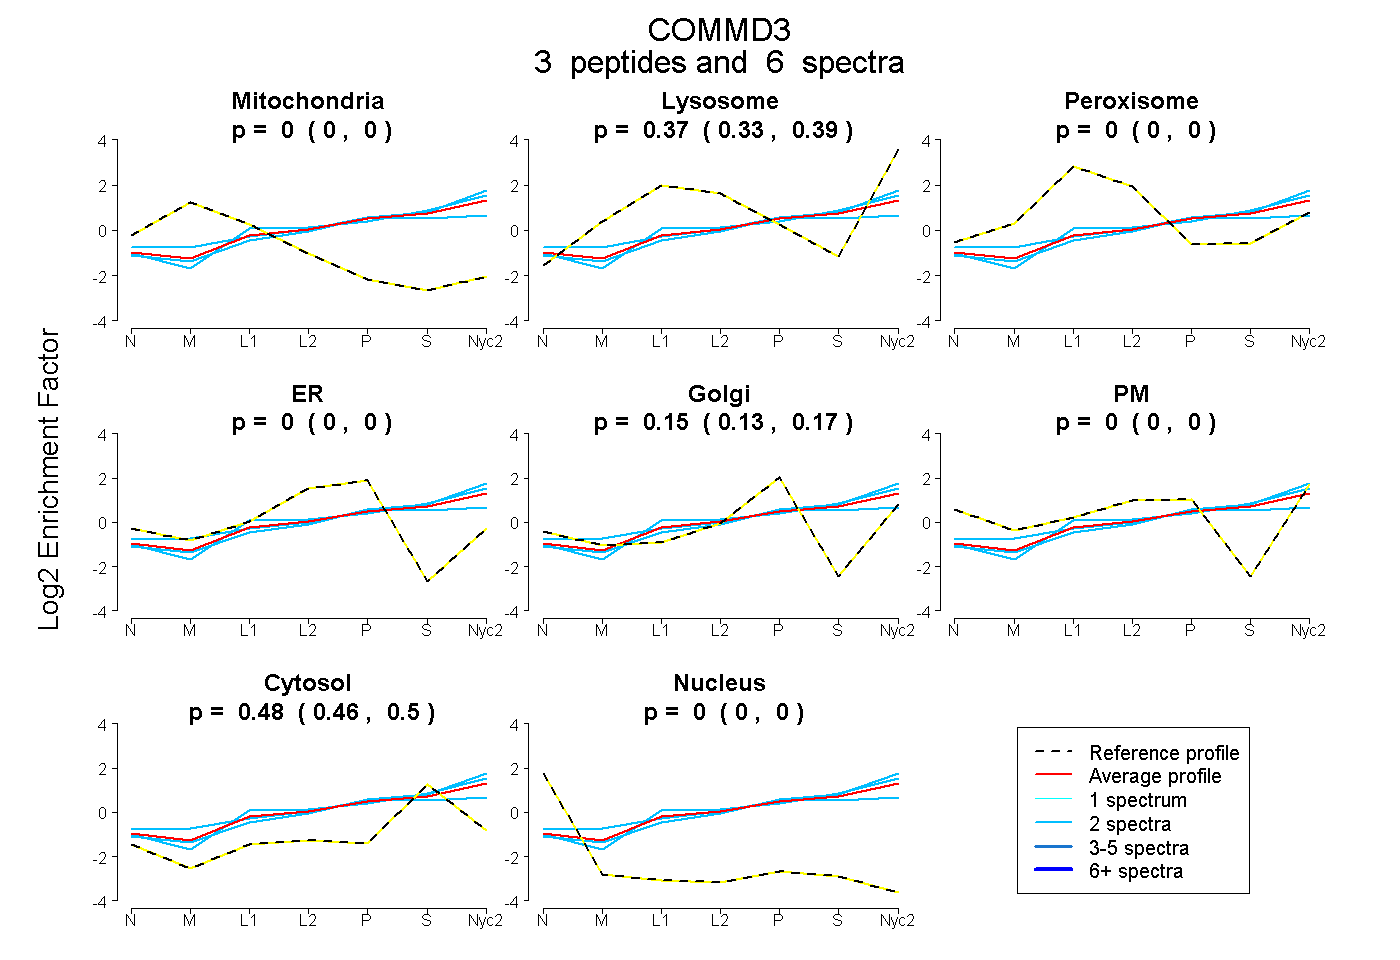
0.000 | 0.000
0.328 | 0.393
0.000 | 0.000
0.000 | 0.000
0.132 | 0.174
0.000 | 0.000
0.460 | 0.499
0.000 | 0.000
| Plot | Mito | Lyso | Perox | ER | Golgi | PM | Cytosol | Nucleus | |||||
| Expt A |
3 peptides |
6 spectra |
|
0.000 0.000 | 0.000 |
0.366 0.328 | 0.393 |
0.000 0.000 | 0.000 |
0.000 0.000 | 0.000 |
0.154 0.132 | 0.174 |
0.000 0.000 | 0.000 |
0.480 0.460 | 0.499 |
0.000 0.000 | 0.000 |
| 2 spectra, HIDPVVLK | 0.000 | 0.416 | 0.000 | 0.000 | 0.080 | 0.000 | 0.504 | 0.000 | ||
| 2 spectra, TNQLHK | 0.000 | 0.379 | 0.000 | 0.000 | 0.146 | 0.000 | 0.475 | 0.000 | ||
| 2 spectra, IELFCTEYQNNK | 0.000 | 0.200 | 0.121 | 0.000 | 0.247 | 0.000 | 0.432 | 0.000 |
| Plot | Lyso | Other | |||||||||||
| Expt C |
4 peptides |
10 spectra |
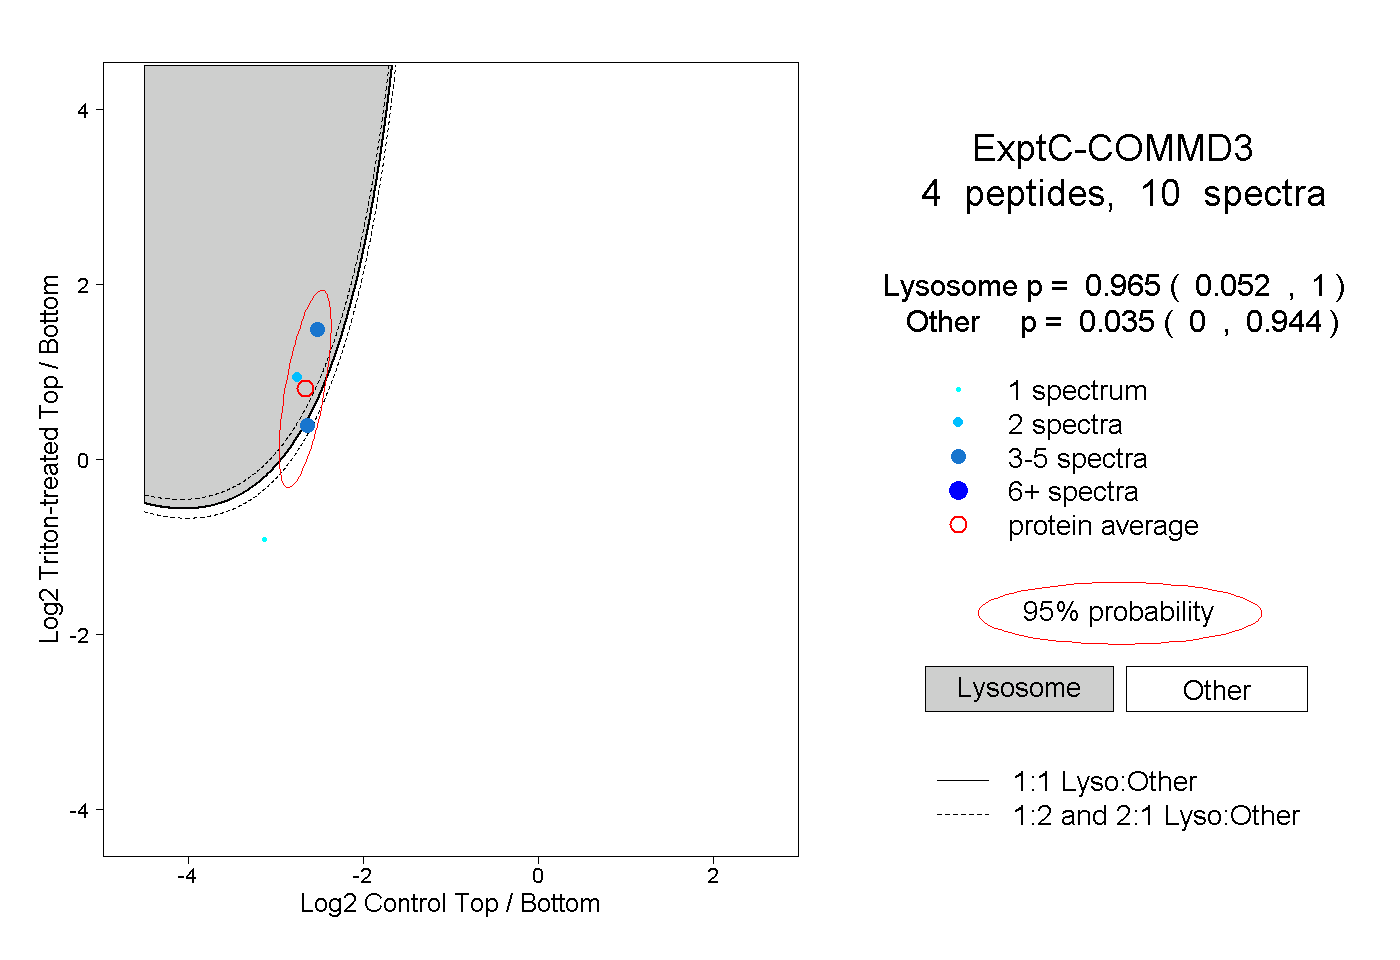 |
0.965 0.052 | 1.000 |
0.035 0.000 | 0.944 |