 6
6peptides
spectra
0.000 | 0.000
0.000 | 0.000
0.000 | 0.044
0.671 | 0.880
0.000 | 0.154
0.000 | 0.067
0.000 | 0.049
0.061 | 0.116
| Plot | Mito | Lyso | Perox | ER | Golgi | PM | Cytosol | Nucleus | |||||
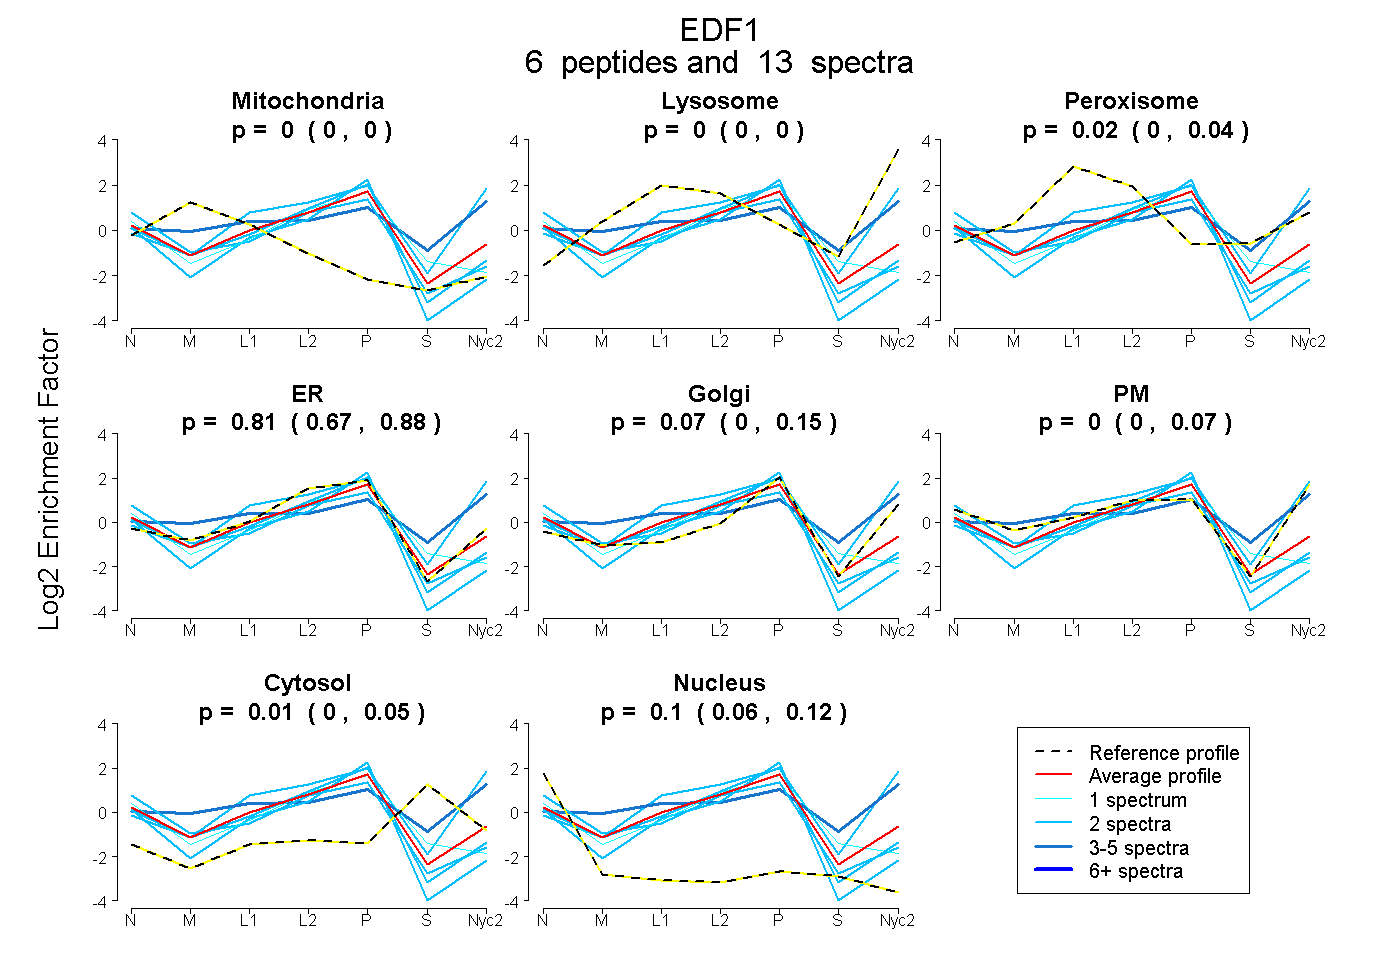
| Expt A |
6 peptides |
13 spectra |
|
0.000 0.000 | 0.000 |
0.000 0.000 | 0.000 |
0.020 0.000 | 0.044 |
0.805 0.671 | 0.880 |
0.073 0.000 | 0.154 |
0.000 0.000 | 0.067 |
0.006 0.000 | 0.049 |
0.095 0.061 | 0.116 |
| 4 spectra, GPTAAQAK | 0.000 | 0.096 | 0.194 | 0.000 | 0.238 | 0.356 | 0.117 | 0.000 | ||
| 2 spectra, AIPNNQVLGK | 0.000 | 0.273 | 0.000 | 0.242 | 0.221 | 0.264 | 0.000 | 0.000 | ||
| 1 spectrum, VTLEVGK | 0.000 | 0.000 | 0.000 | 0.753 | 0.000 | 0.000 | 0.126 | 0.121 | ||
| 2 spectra, WAAGQNK | 0.000 | 0.000 | 0.000 | 0.888 | 0.000 | 0.000 | 0.000 | 0.112 | ||
| 2 spectra, QAILAAQR | 0.000 | 0.000 | 0.000 | 0.798 | 0.000 | 0.000 | 0.000 | 0.202 | ||
| 2 spectra, QHSITK | 0.000 | 0.000 | 0.000 | 0.796 | 0.000 | 0.000 | 0.000 | 0.204 |
| Plot | Mito | Lyso or Perox | ER | Golgi | PM | Cytosol | Nucleus | ||||||
| Expt B |
4 peptides |
5 spectra |
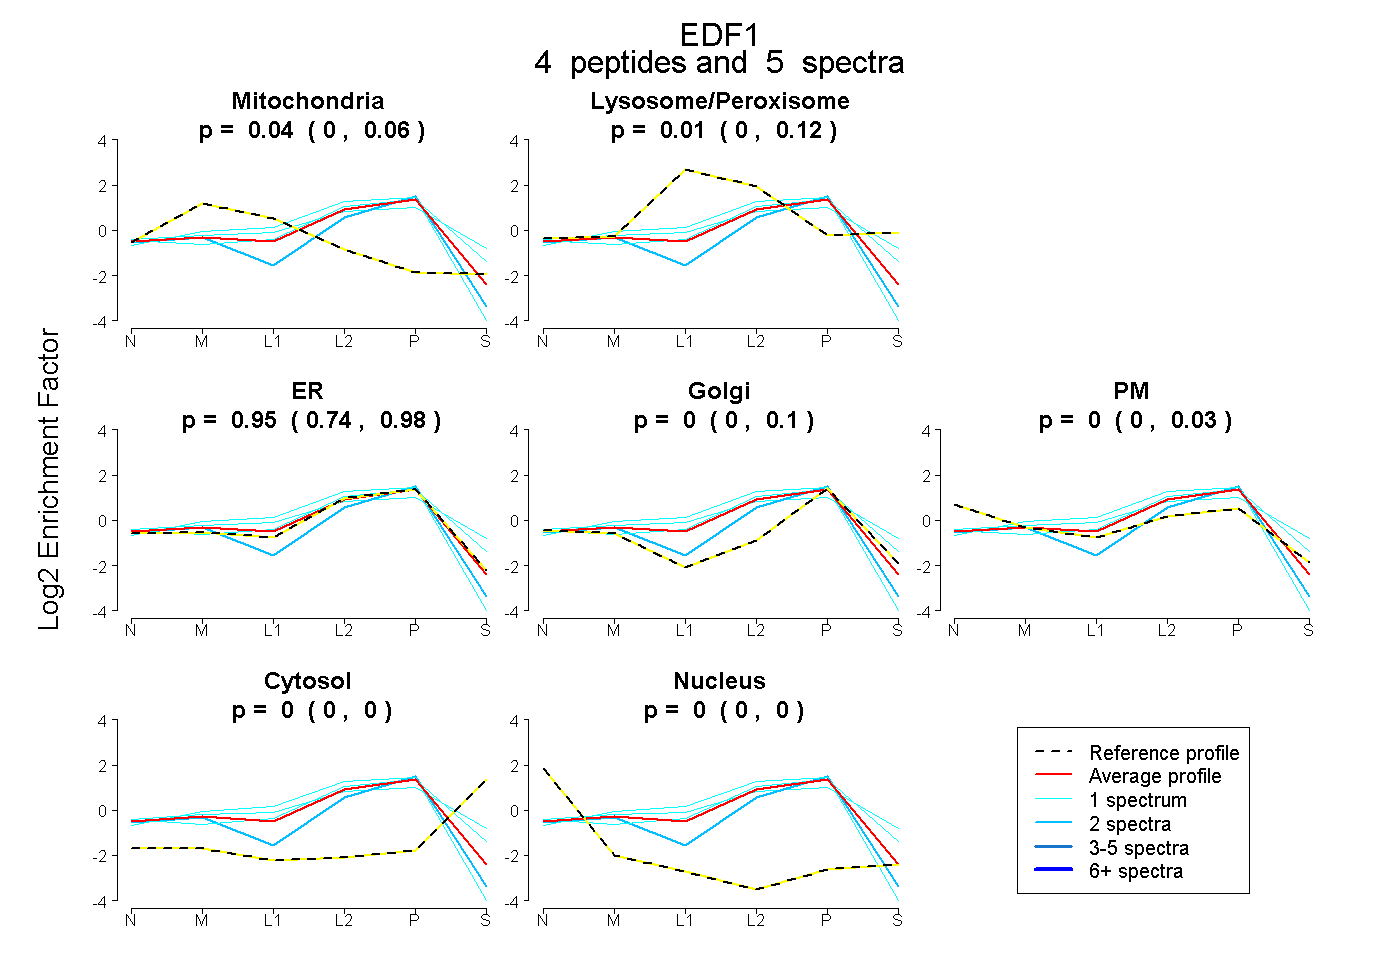 |
0.043 0.000 | 0.061 |
0.008 0.000 | 0.117 |
0.948 0.736 | 0.977 |
0.000 0.000 | 0.100 |
0.000 0.000 | 0.033 |
0.000 0.000 | 0.000 |
0.000 0.000 | 0.000 |
|||
| Plot | Lyso | Other | |||||||||||
| Expt C |
7 peptides |
23 spectra |
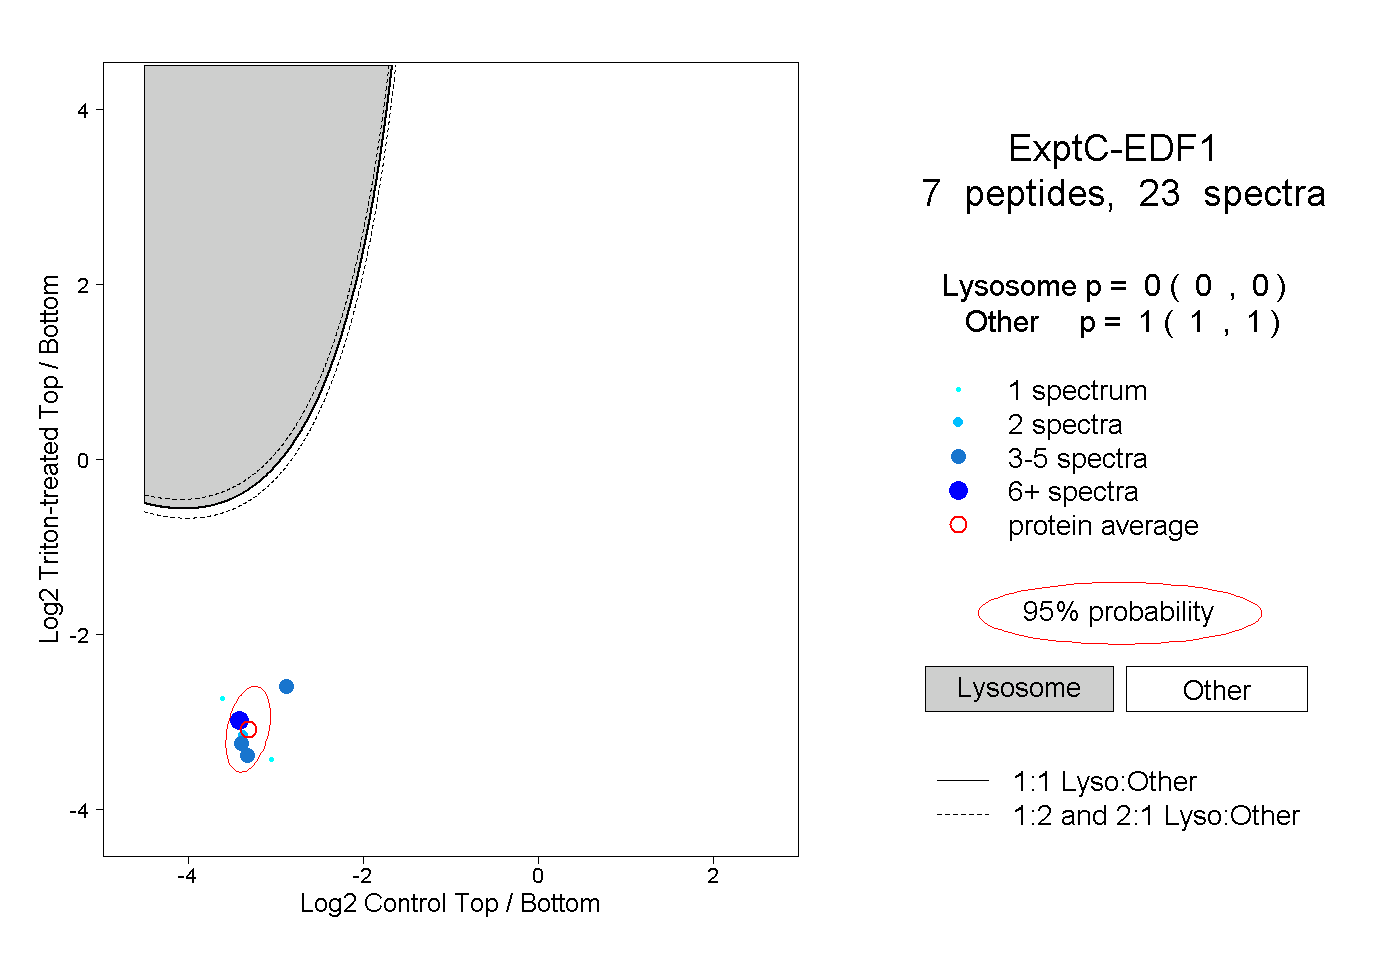 |
0.000 0.000 | 0.000 |
1.000 1.000 | 1.000 |
||||||||
| Plot | Lyso | Other | |||||||||||
| Expt D |
2 peptides |
3 spectra |
 |
0.000 0.000 | 0.000 |
1.000 1.000 | 1.000 |