 4
4peptides
spectra
0.000 | 0.000
0.299 | 0.339
0.546 | 0.638
0.000 | 0.051
0.000 | 0.000
0.044 | 0.076
0.000 | 0.000
7peptides
spectra
0.000 | 0.000
1.000 | 1.000
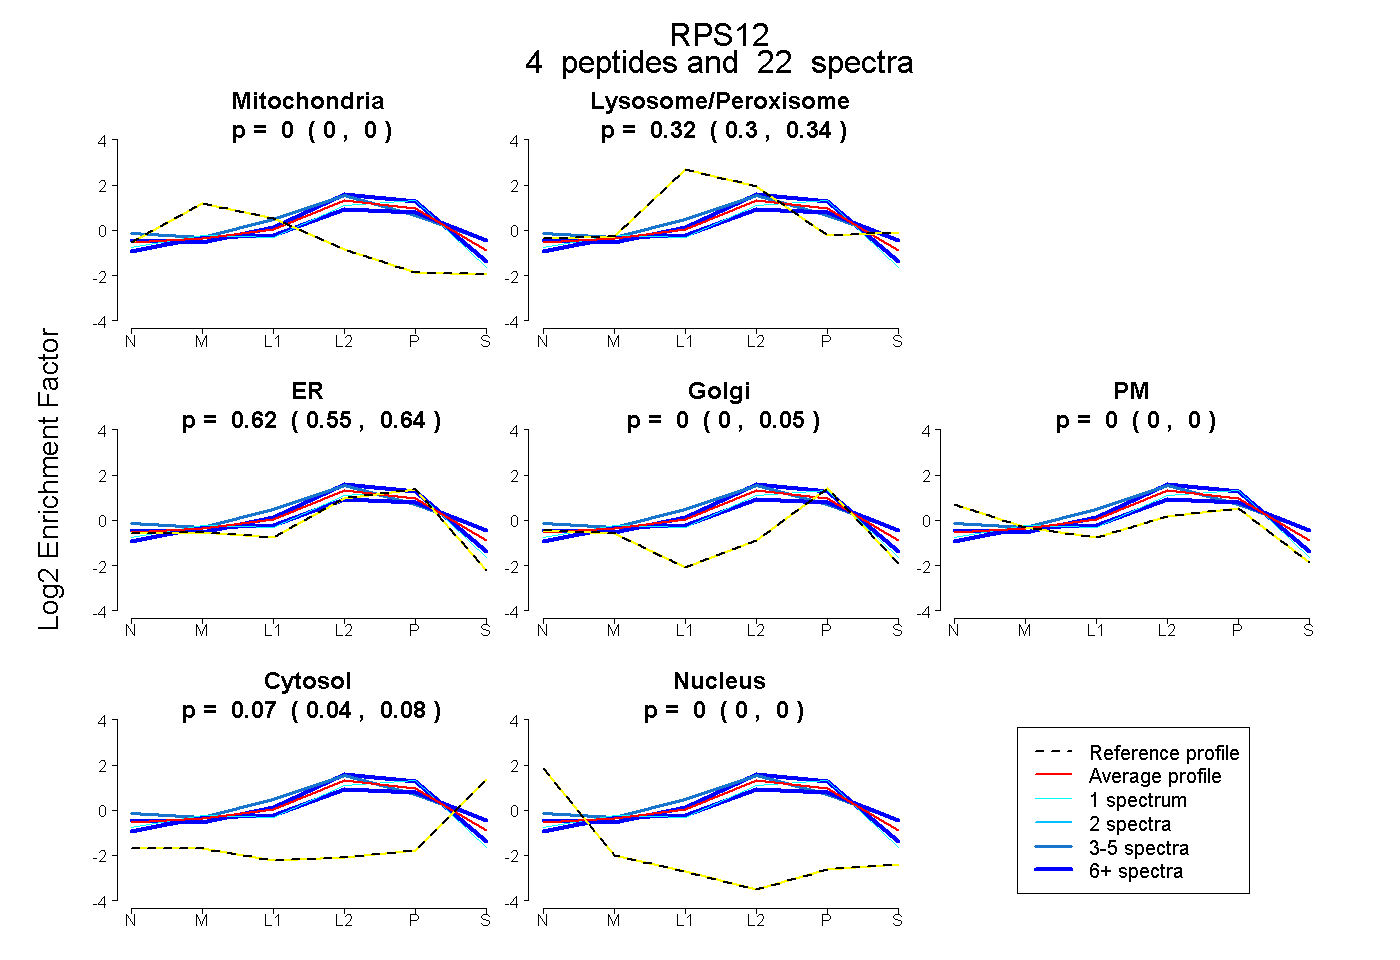
| Plot | Mito | Lyso or Perox | ER | Golgi | PM | Cytosol | Nucleus | ||||||
| Expt B |
4 peptides |
22 spectra |
|
0.000 0.000 | 0.000 |
0.316 0.299 | 0.339 |
0.619 0.546 | 0.638 |
0.000 0.000 | 0.051 |
0.000 0.000 | 0.000 |
0.065 0.044 | 0.076 |
0.000 0.000 | 0.000 |
|||
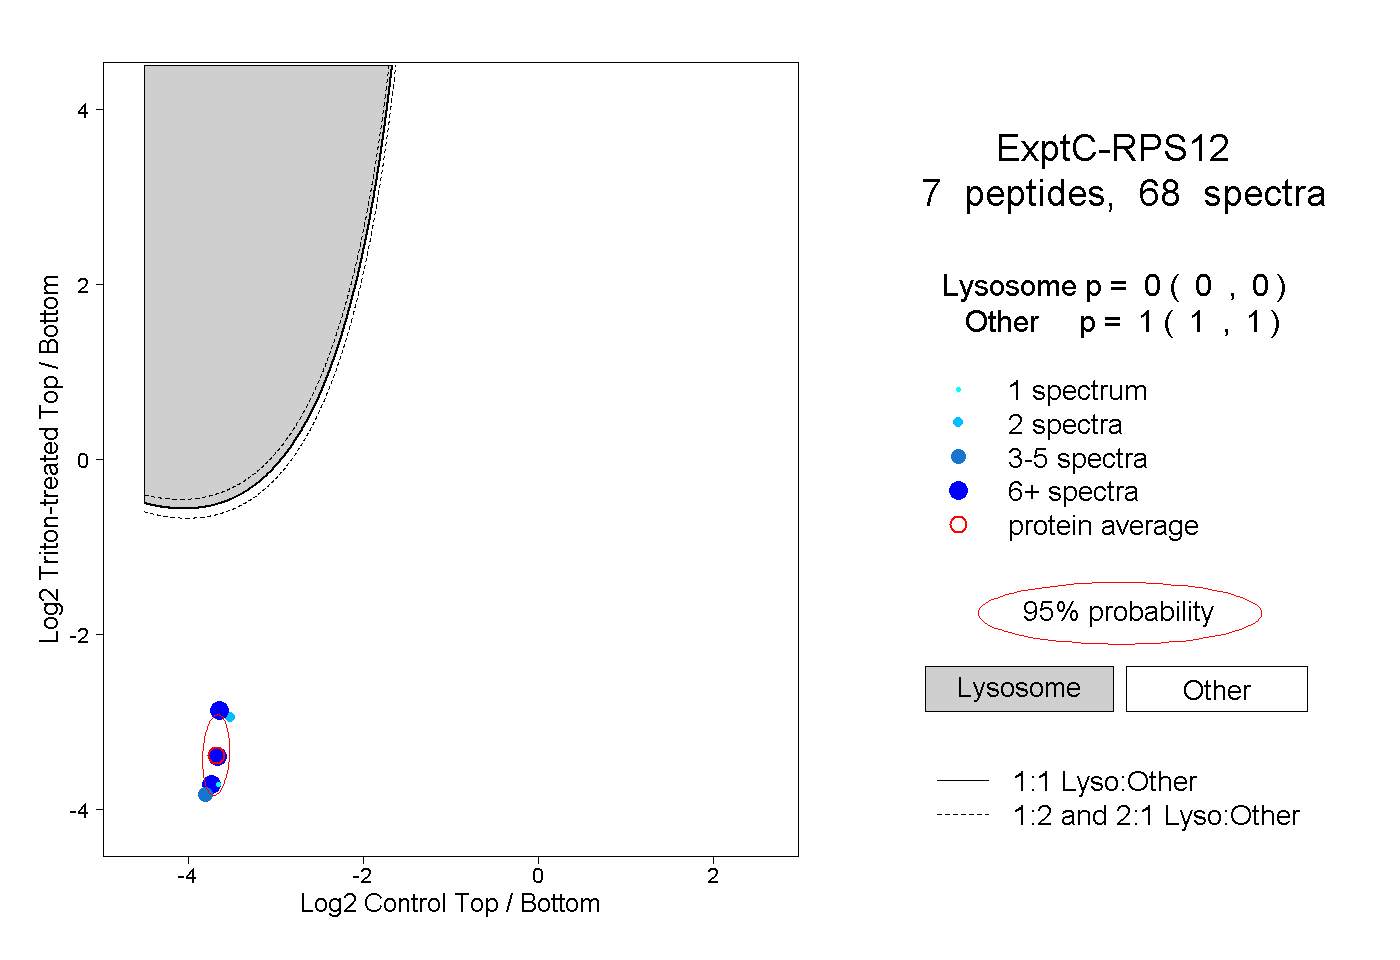
| Plot | Lyso | Other | |||||||||||
| Expt C |
7 peptides |
68 spectra |
|
0.000 0.000 | 0.000 |
1.000 1.000 | 1.000 |
| 1 spectrum, VDDNK | 0.000 | 1.000 | ||||||||
| 2 spectra, QAHLCVLASNCDEPMYVK | 0.000 | 1.000 | ||||||||
| 3 spectra, VVGCSCVVVK | 0.000 | 1.000 | ||||||||
| 17 spectra, TALIHDGLAR | 0.000 | 1.000 | ||||||||
| 9 spectra, LGEWVGLCK | 0.000 | 1.000 | ||||||||
| 22 spectra, DVIEEYFK | 0.000 | 1.000 | ||||||||
| 14 spectra, LVEALCAEHQINLIK | 0.000 | 1.000 |