 4
4peptides
spectra
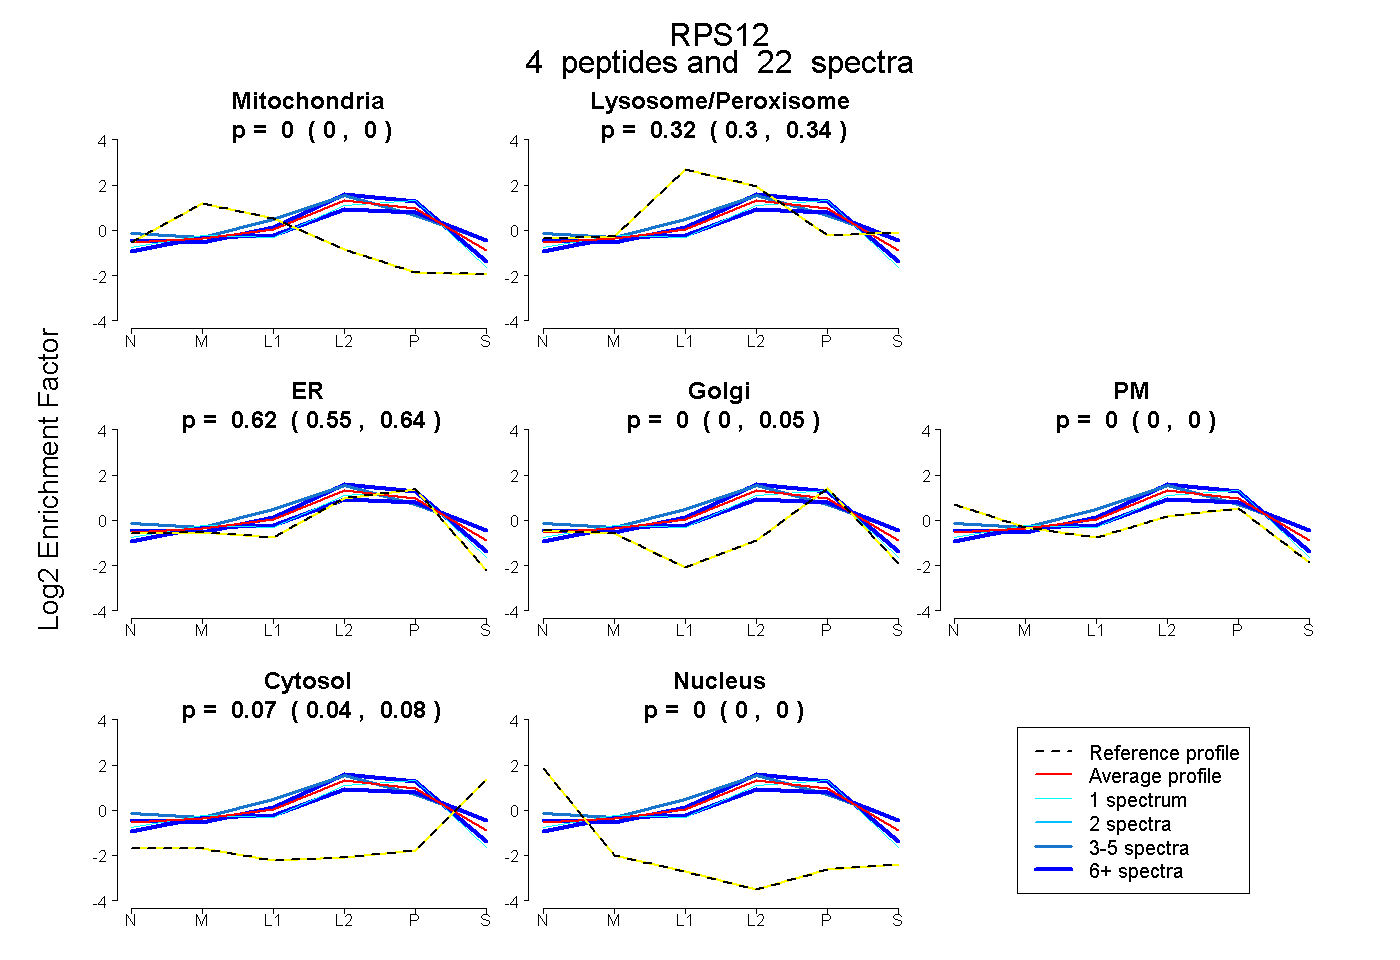
0.000 | 0.000
0.299 | 0.339
0.546 | 0.638
0.000 | 0.051
0.000 | 0.000
0.044 | 0.076
0.000 | 0.000
| Plot | Mito | Lyso or Perox | ER | Golgi | PM | Cytosol | Nucleus | ||||||
| Expt B |
4 peptides |
22 spectra |
|
0.000 0.000 | 0.000 |
0.316 0.299 | 0.339 |
0.619 0.546 | 0.638 |
0.000 0.000 | 0.051 |
0.000 0.000 | 0.000 |
0.065 0.044 | 0.076 |
0.000 0.000 | 0.000 |
| 1 spectrum, VDDNK | 0.000 | 0.159 | 0.792 | 0.048 | 0.000 | 0.000 | 0.000 | |||
| 9 spectra, TALIHDGLAR | 0.000 | 0.282 | 0.541 | 0.000 | 0.000 | 0.177 | 0.000 | |||
| 8 spectra, DVIEEYFK | 0.000 | 0.281 | 0.719 | 0.000 | 0.000 | 0.000 | 0.000 | |||
| 4 spectra, LVEALCAEHQINLIK | 0.000 | 0.469 | 0.378 | 0.000 | 0.102 | 0.051 | 0.000 |
| Plot | Lyso | Other | |||||||||||
| Expt C |
7 peptides |
68 spectra |
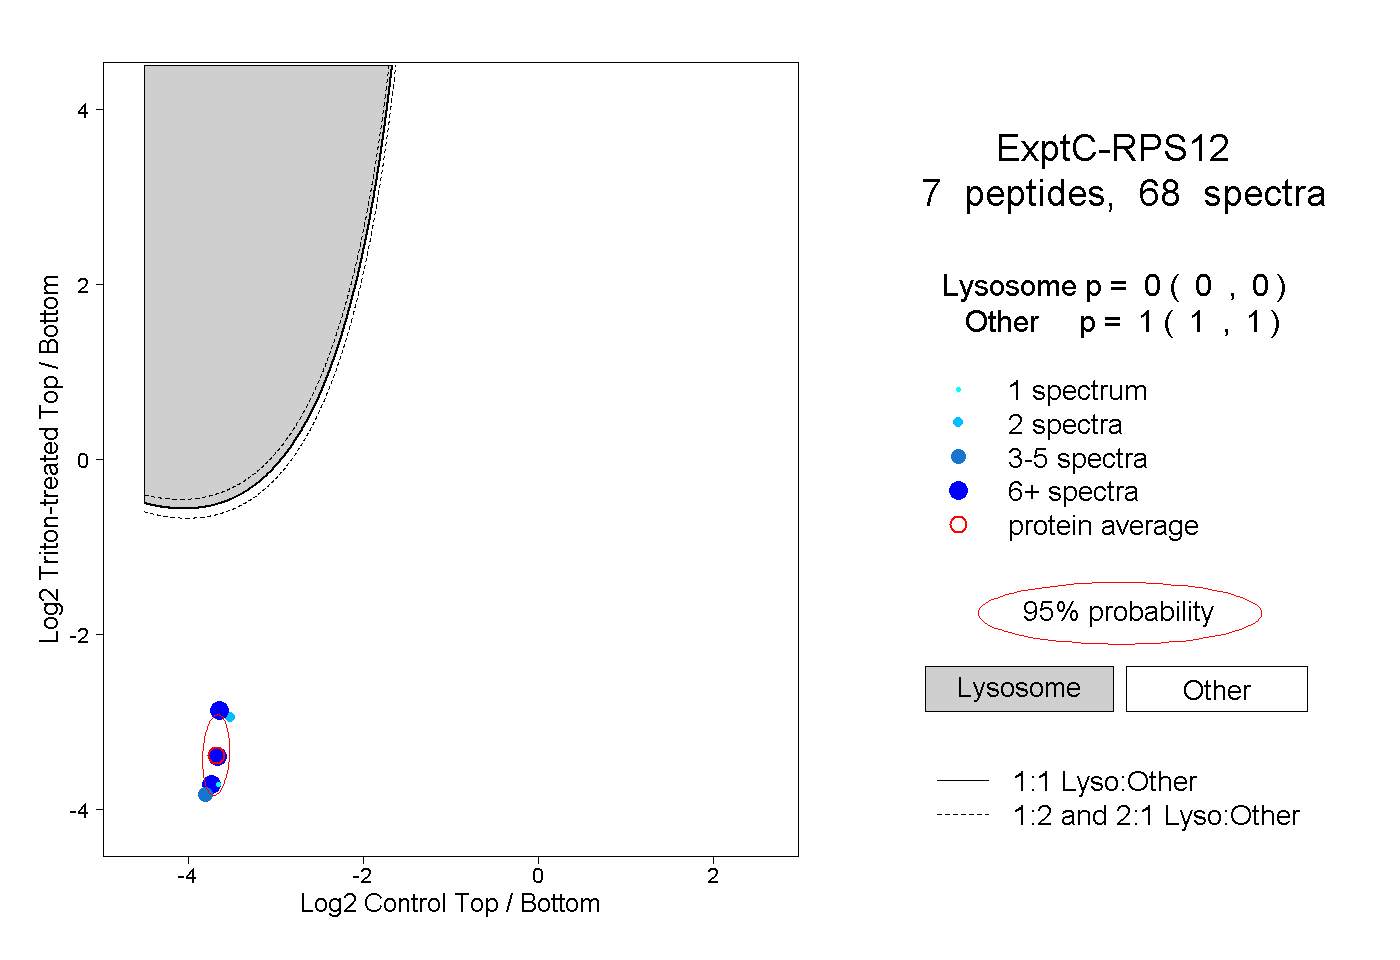 |
0.000 0.000 | 0.000 |
1.000 1.000 | 1.000 |