 6
6peptides
spectra
0.000 | 0.013
0.000 | 0.000
0.000 | 0.015
0.128 | 0.184
0.000 | 0.011
0.791 | 0.851
0.000 | 0.024
0.000 | 0.010
4peptides
spectra
0.000 | 0.000
0.999 | 1.000
| Plot | Mito | Lyso | Perox | ER | Golgi | PM | Cytosol | Nucleus | |||||
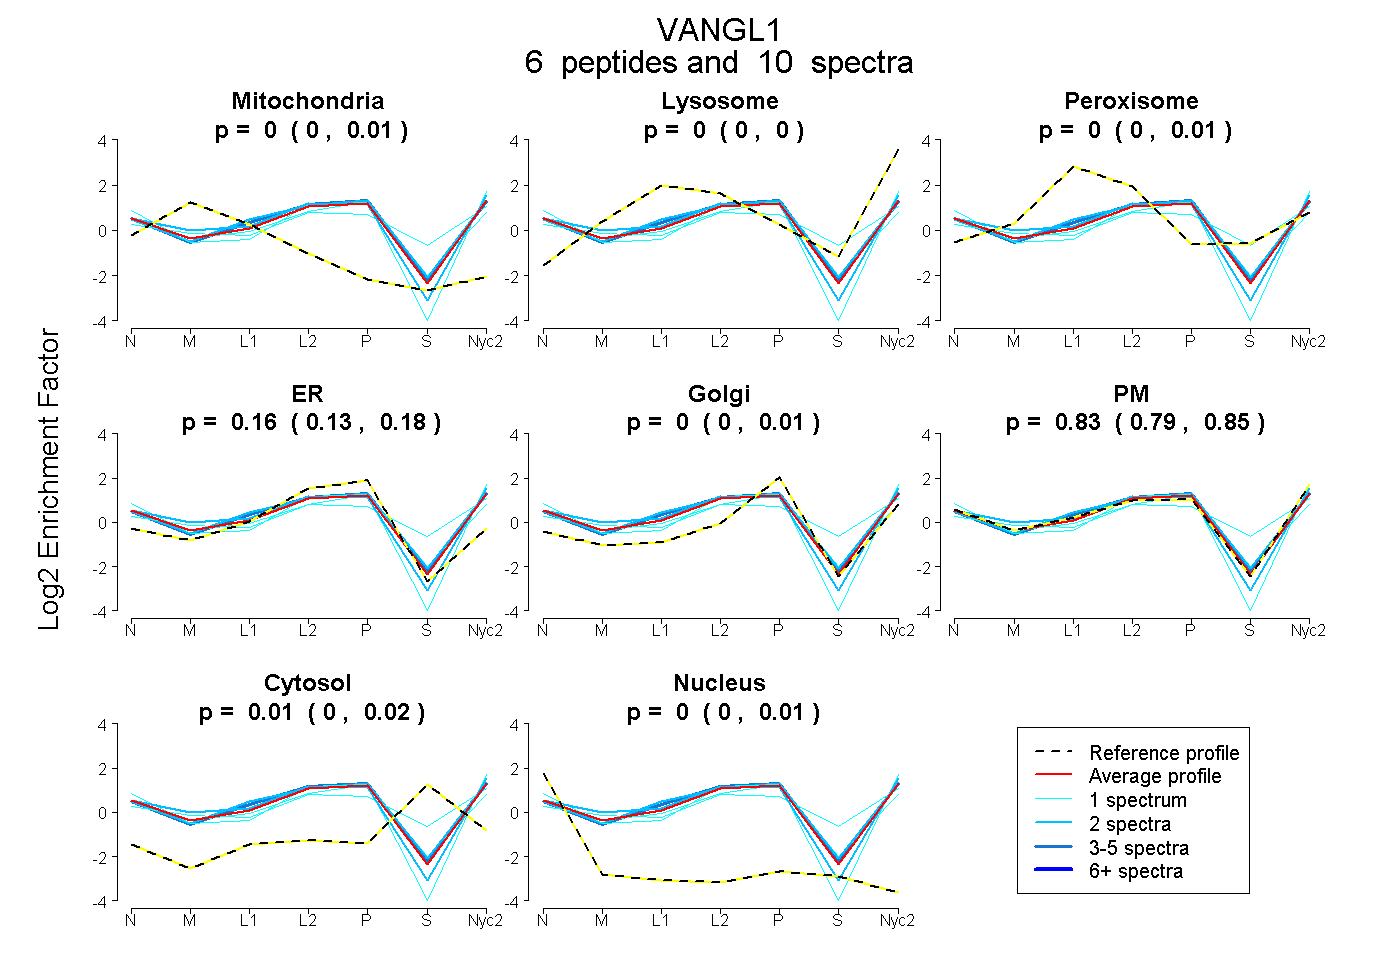
| Expt A |
6 peptides |
10 spectra |
|
0.003 0.000 | 0.013 |
0.000 0.000 | 0.000 |
0.000 0.000 | 0.015 |
0.162 0.128 | 0.184 |
0.000 0.000 | 0.011 |
0.827 0.791 | 0.851 |
0.005 0.000 | 0.024 |
0.003 0.000 | 0.010 |
||
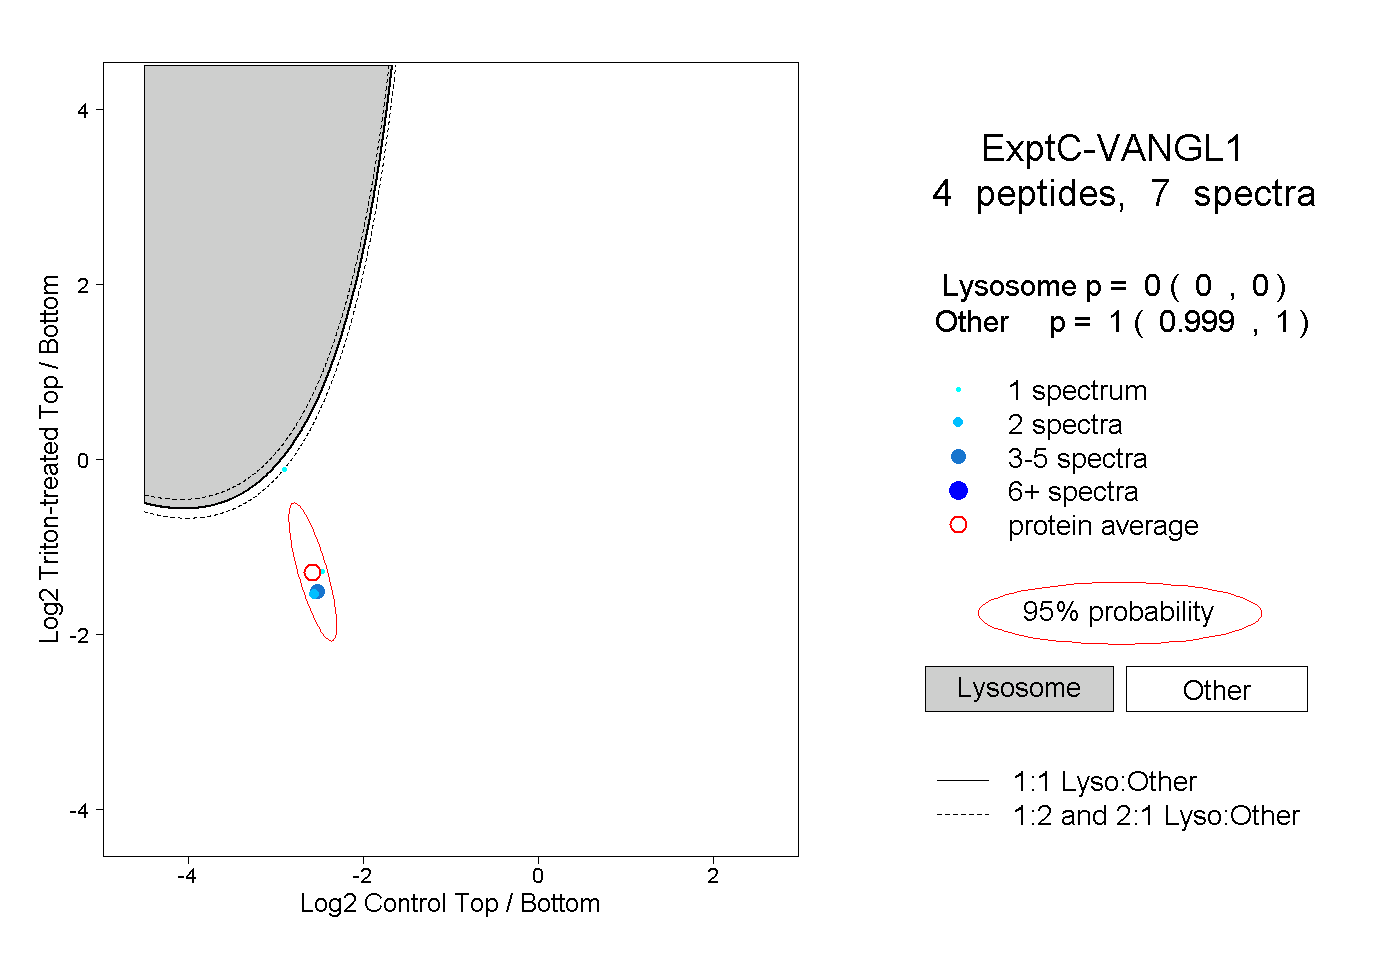
| Plot | Lyso | Other | |||||||||||
| Expt C |
4 peptides |
7 spectra |
|
0.000 0.000 | 0.000 |
1.000 0.999 | 1.000 |