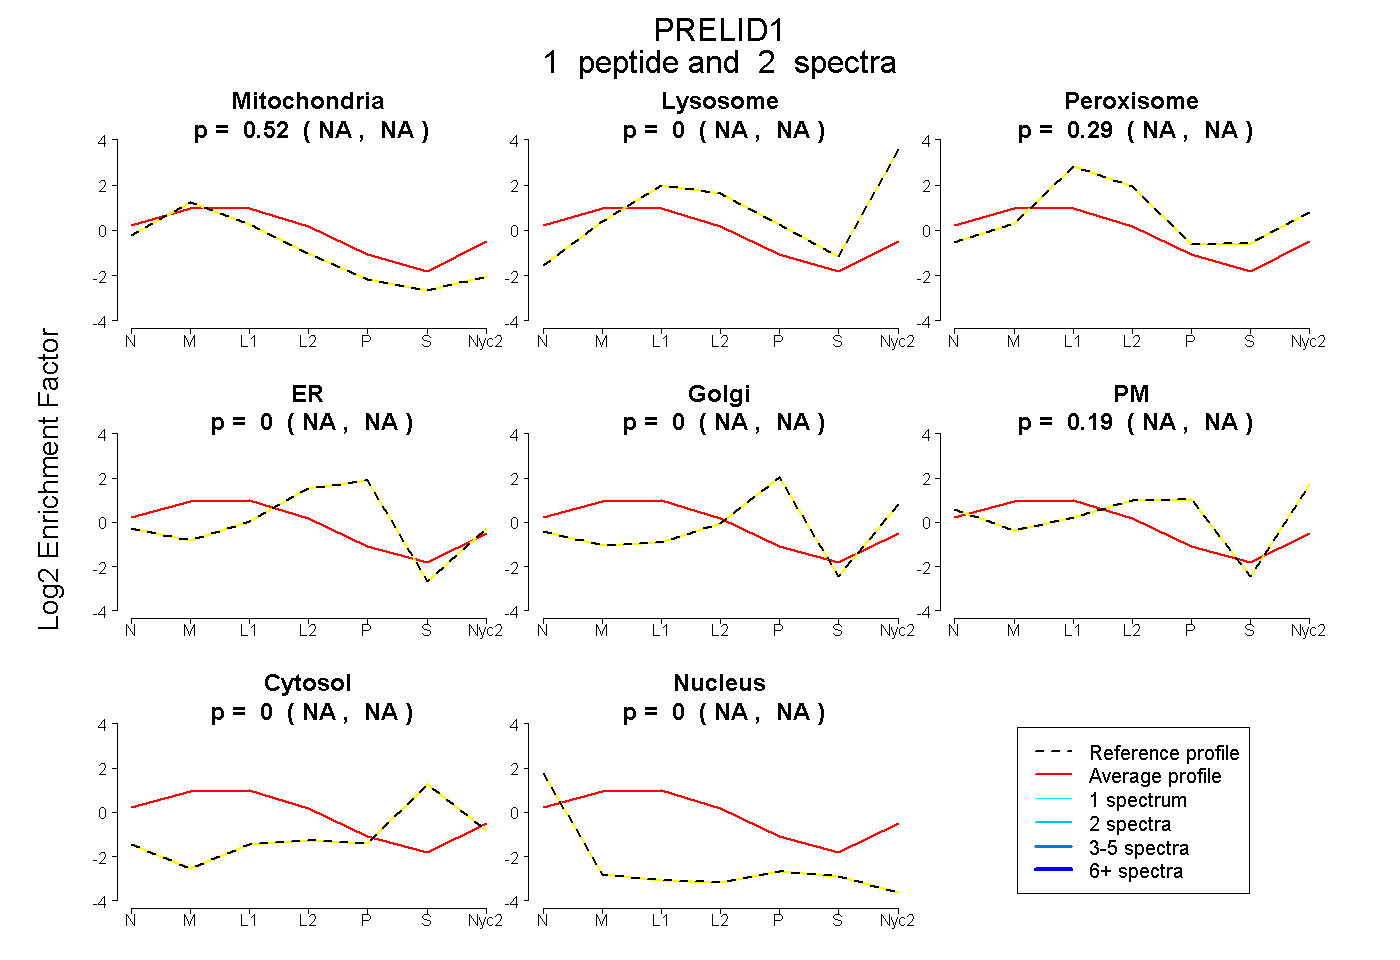
 1
1peptide
spectra
NA | NA
NA | NA
NA | NA
NA | NA
NA | NA
NA | NA
NA | NA
NA | NA
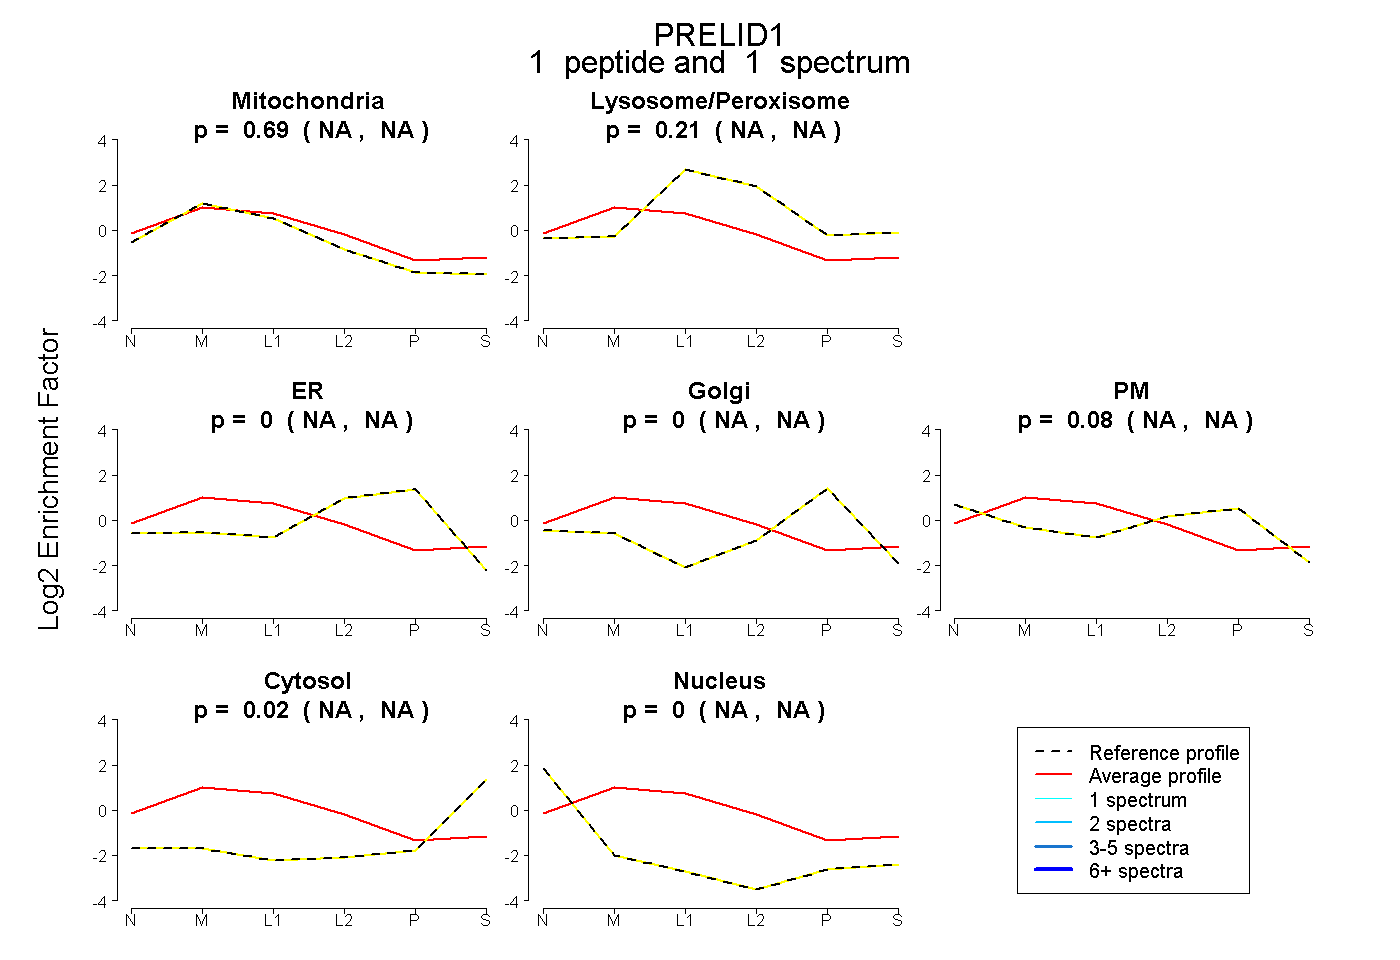
1peptide
spectrum
NA | NA
NA | NA
NA | NA
NA | NA
NA | NA
NA | NA
NA | NA
5peptides
spectra
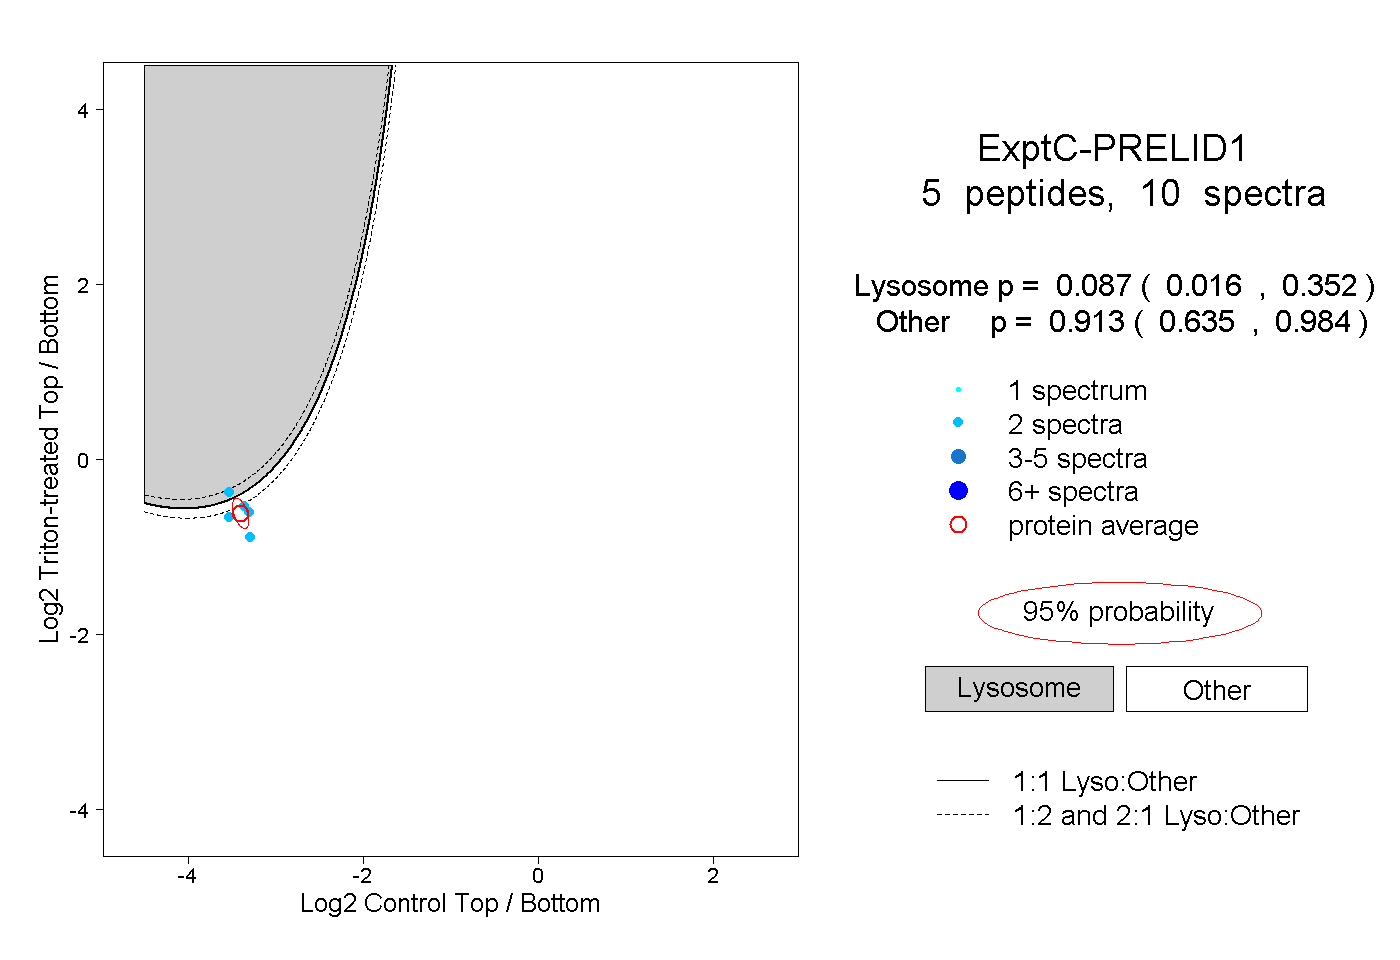
0.016 | 0.352
0.635 | 0.984