 24
24peptides
spectra
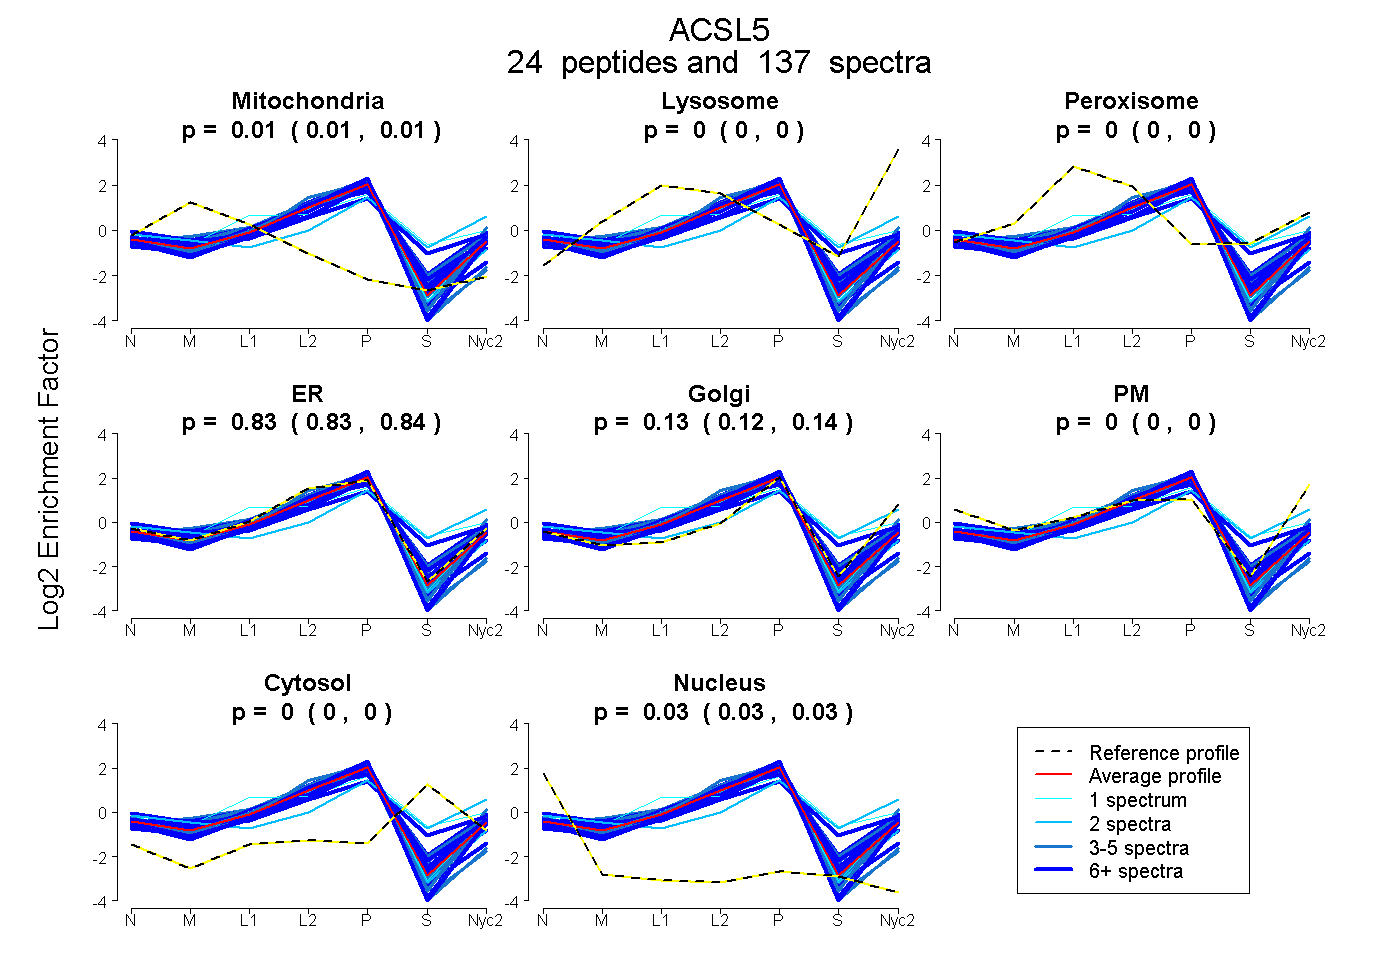
0.007 | 0.011
0.000 | 0.000
0.000 | 0.000
0.827 | 0.840
0.122 | 0.135
0.000 | 0.000
0.000 | 0.000
0.025 | 0.029
21peptides
spectra
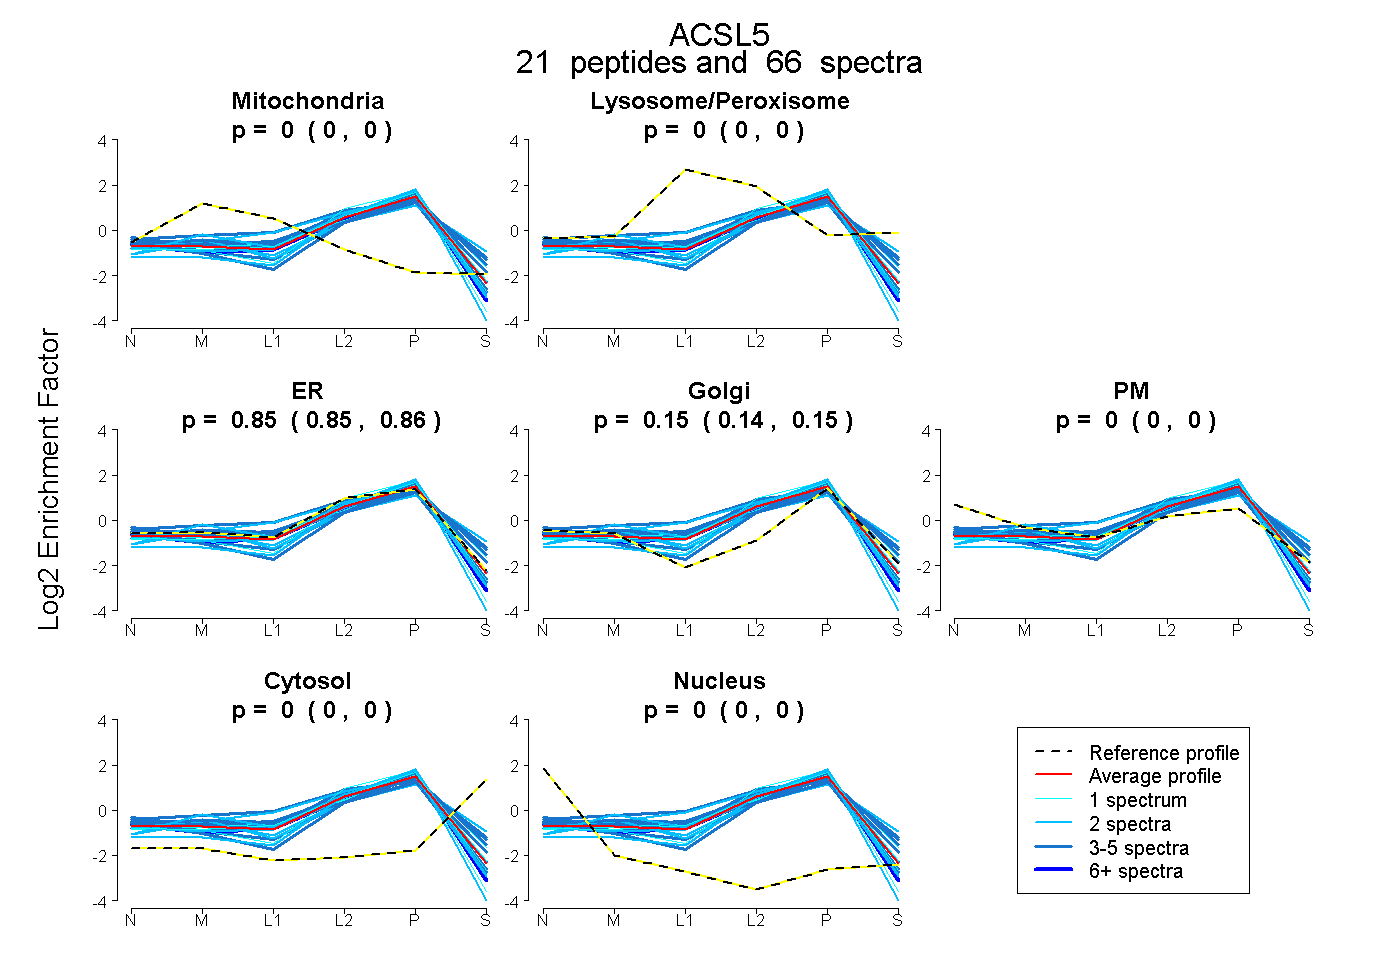
0.000 | 0.000
0.000 | 0.000
0.847 | 0.860
0.139 | 0.152
0.000 | 0.000
0.000 | 0.000
0.000 | 0.000
23peptides
spectra
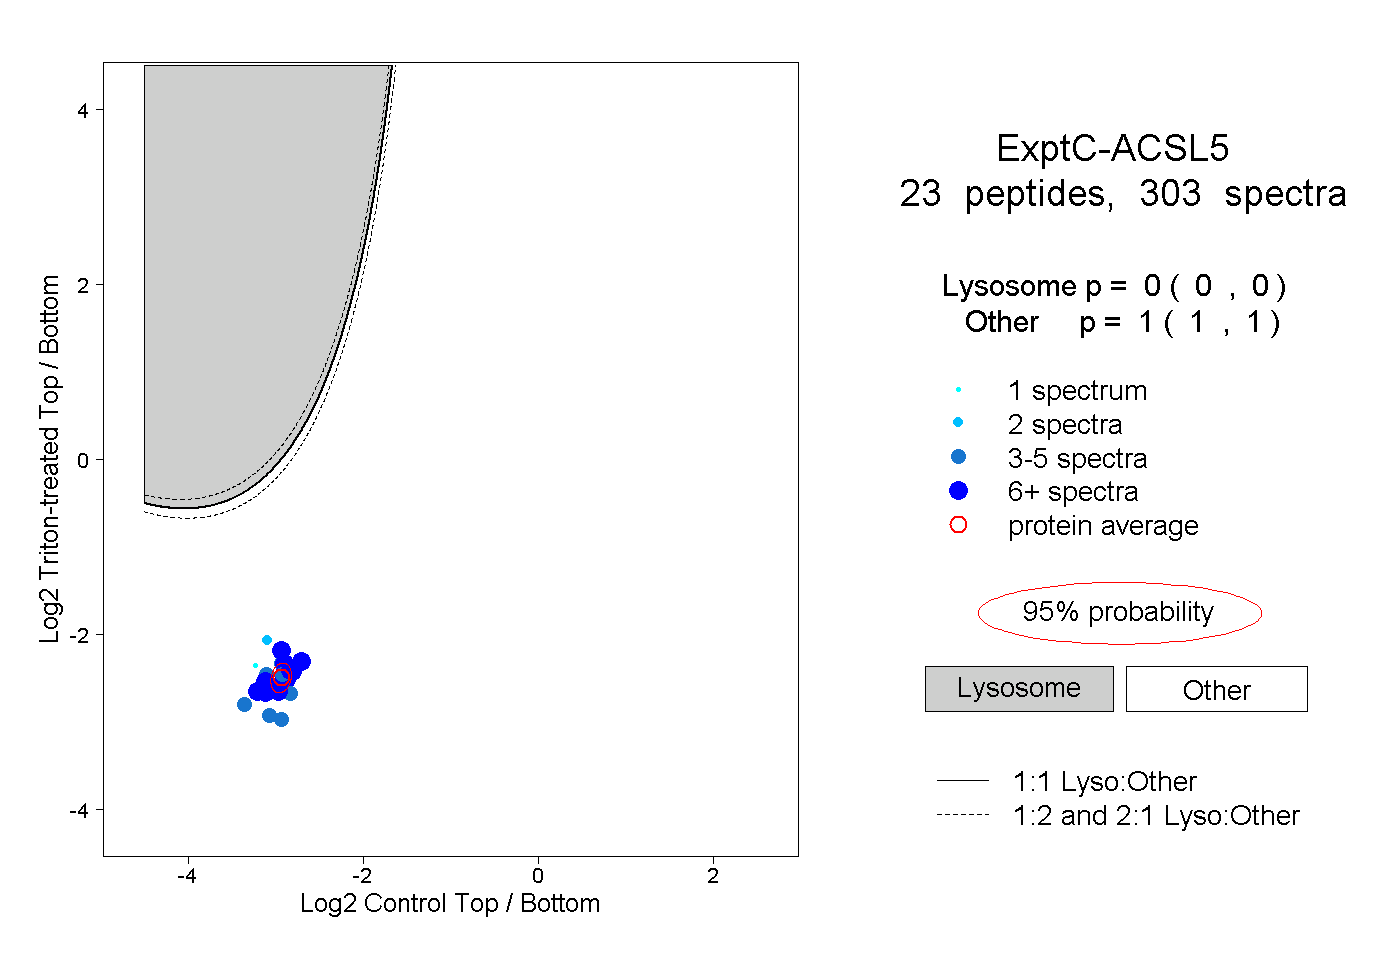
0.000 | 0.000
1.000 | 1.000
9peptides
spectra
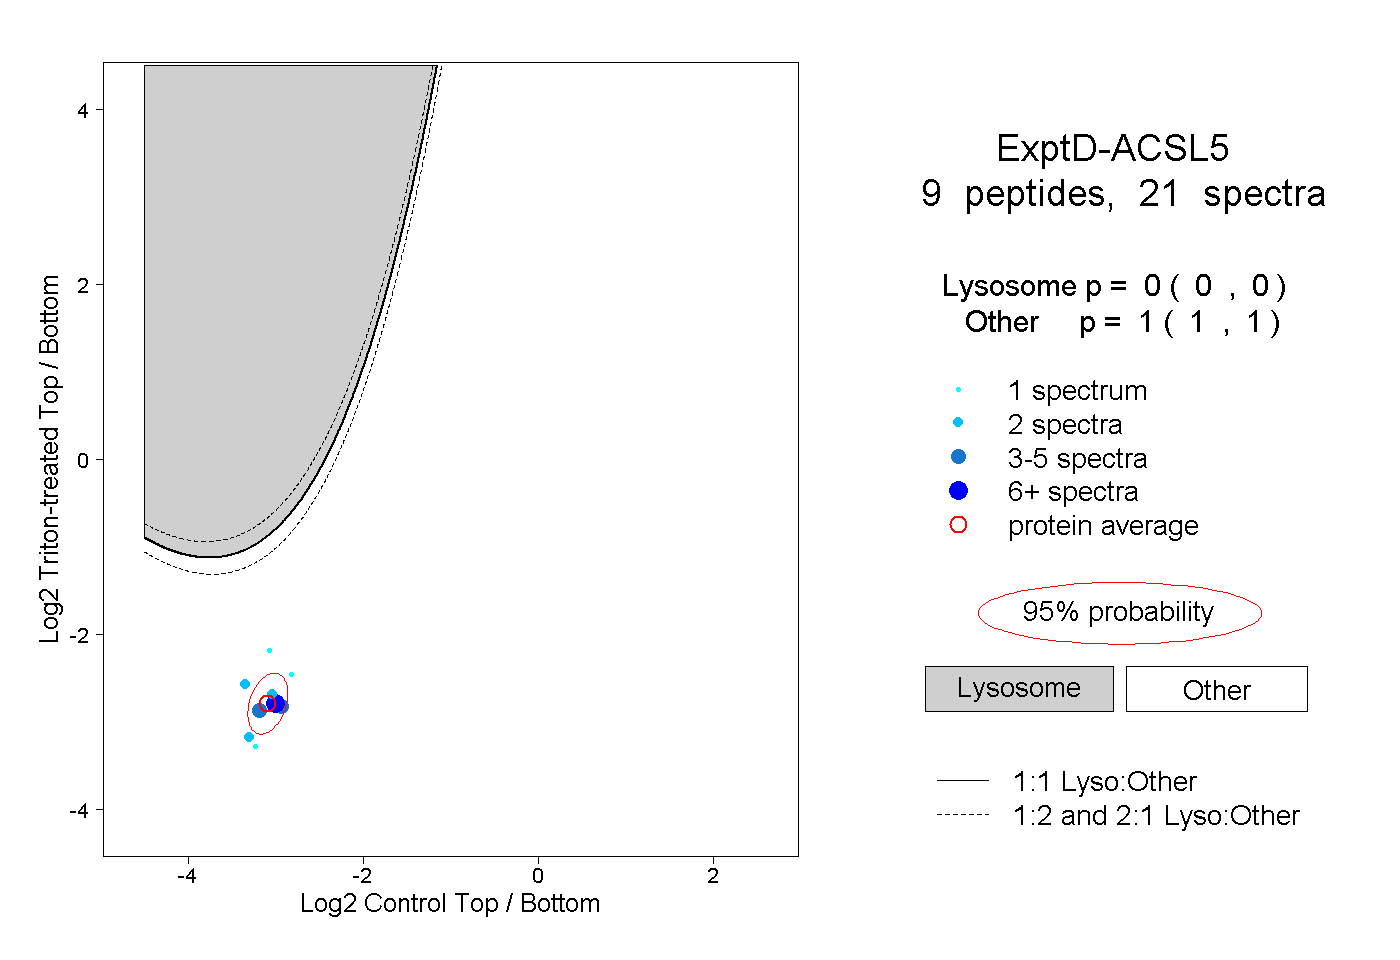
0.000 | 0.000
1.000 | 1.000