 6
6peptides
spectra
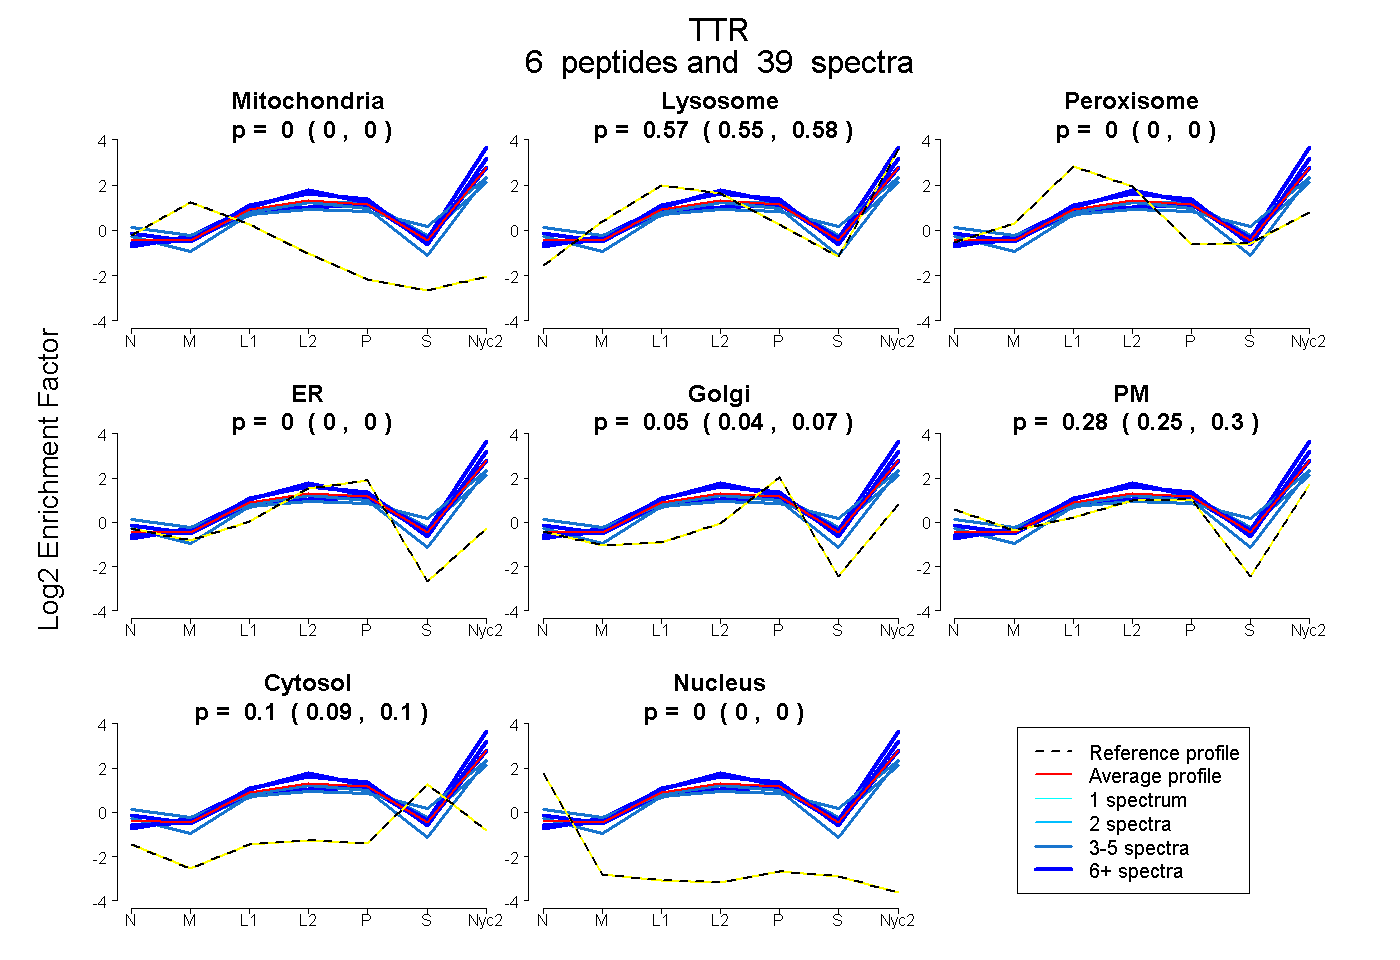
0.000 | 0.000
0.554 | 0.579
0.000 | 0.000
0.000 | 0.000
0.036 | 0.071
0.253 | 0.302
0.088 | 0.103
0.000 | 0.000
6peptides
spectra
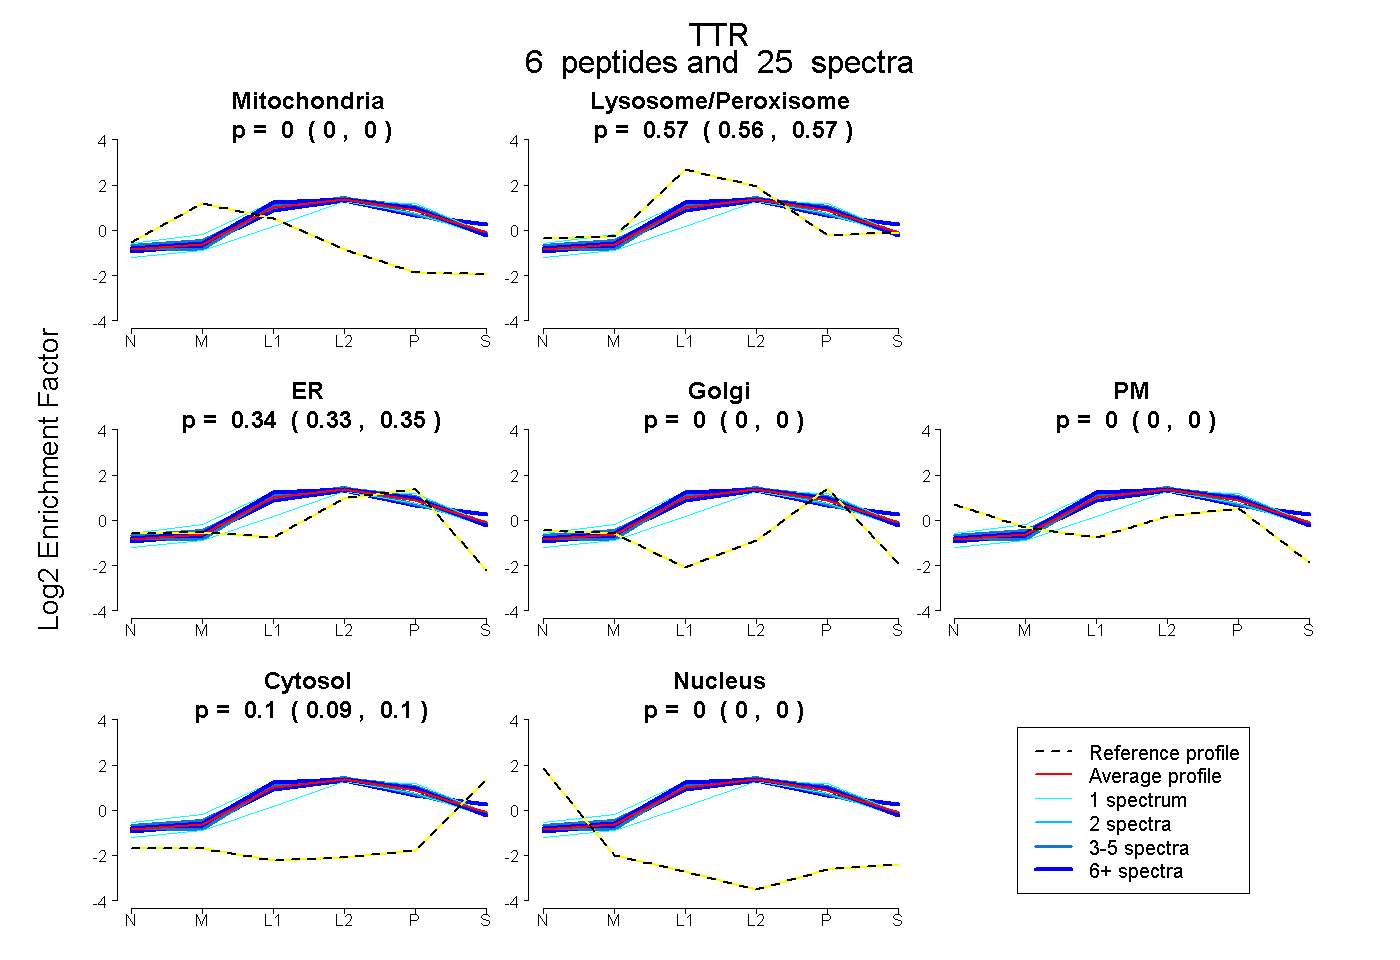
0.000 | 0.000
0.556 | 0.574
0.327 | 0.346
0.000 | 0.001
0.000 | 0.000
0.091 | 0.101
0.000 | 0.000
7peptides
spectra
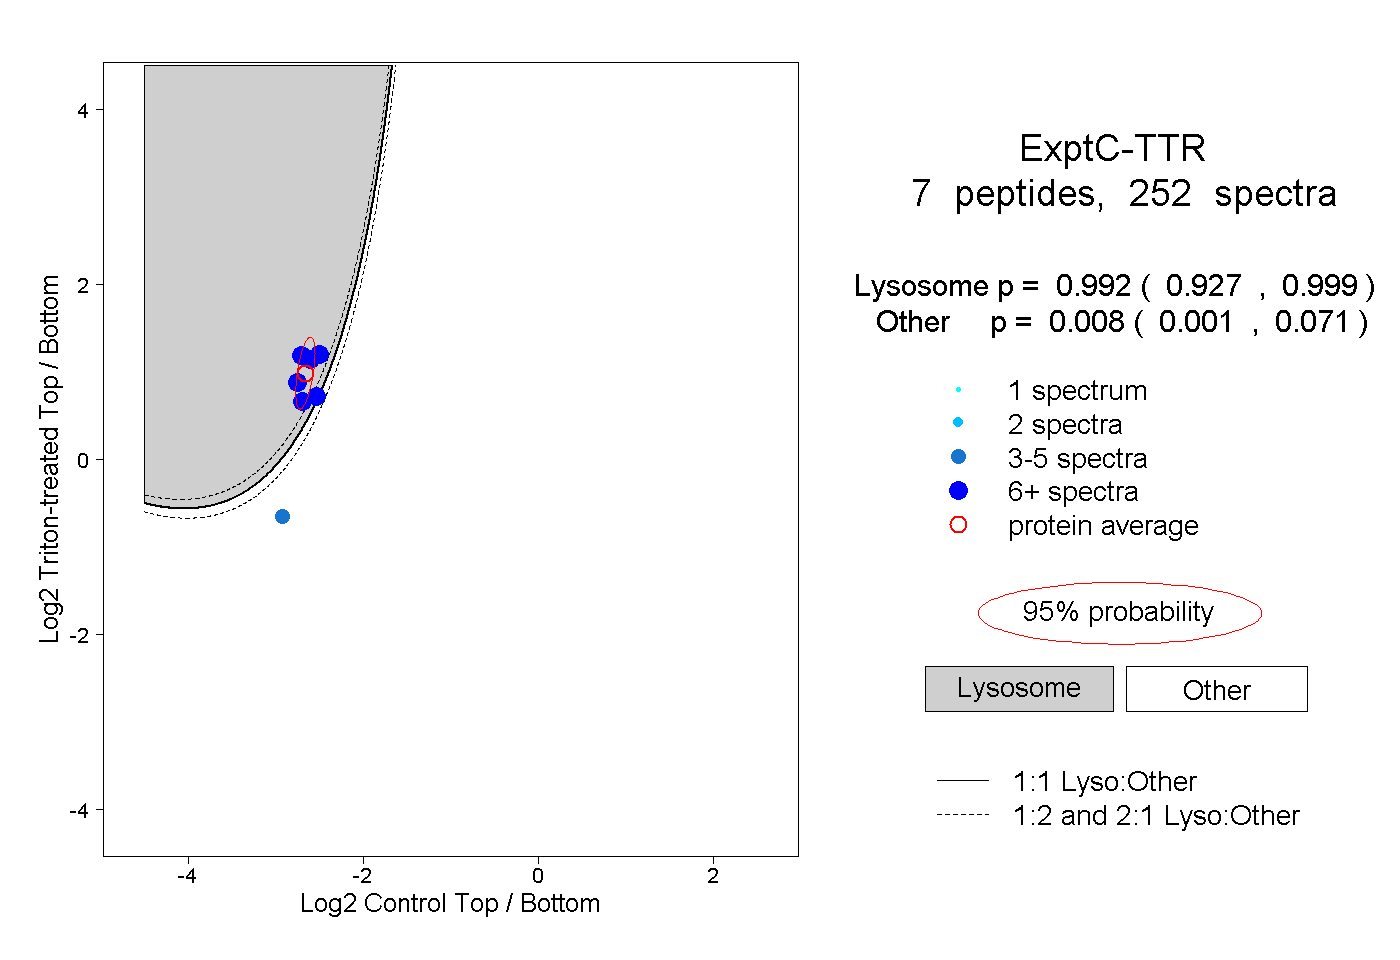
0.927 | 0.999
0.001 | 0.071
5peptides
spectra
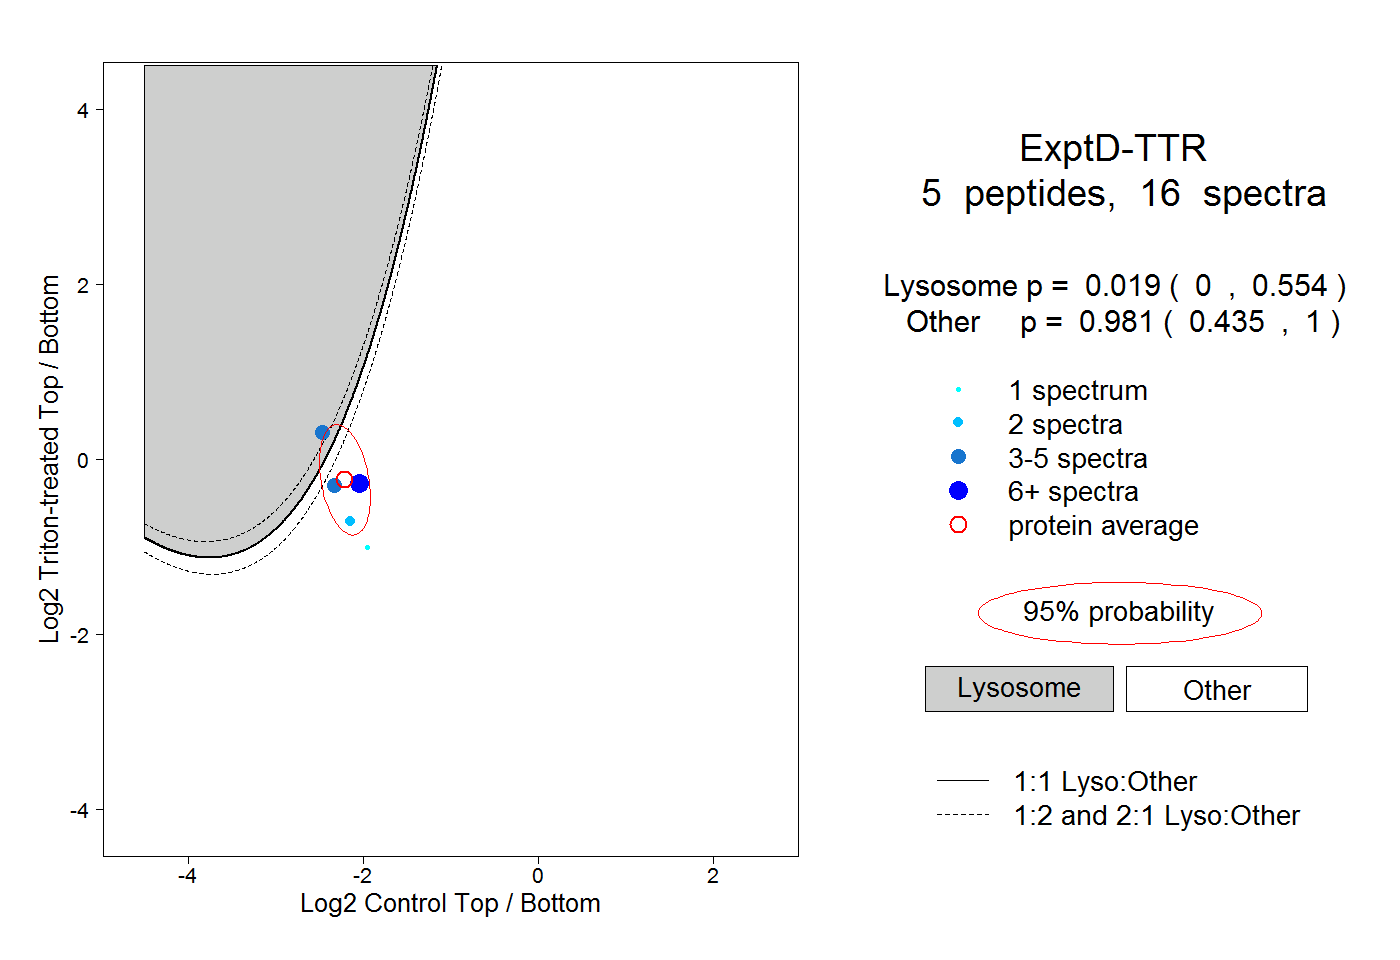
0.000 | 0.554
0.435 | 1.000