PTBP3
[ENSRNOP00000022107]
Main page
| | | Plot |
Mito |
Lyso |
|
Perox |
ER |
Golgi |
PM |
Cytosol |
Nucleus |
|
| Expt A |
 8
8
peptides |
20
spectra |
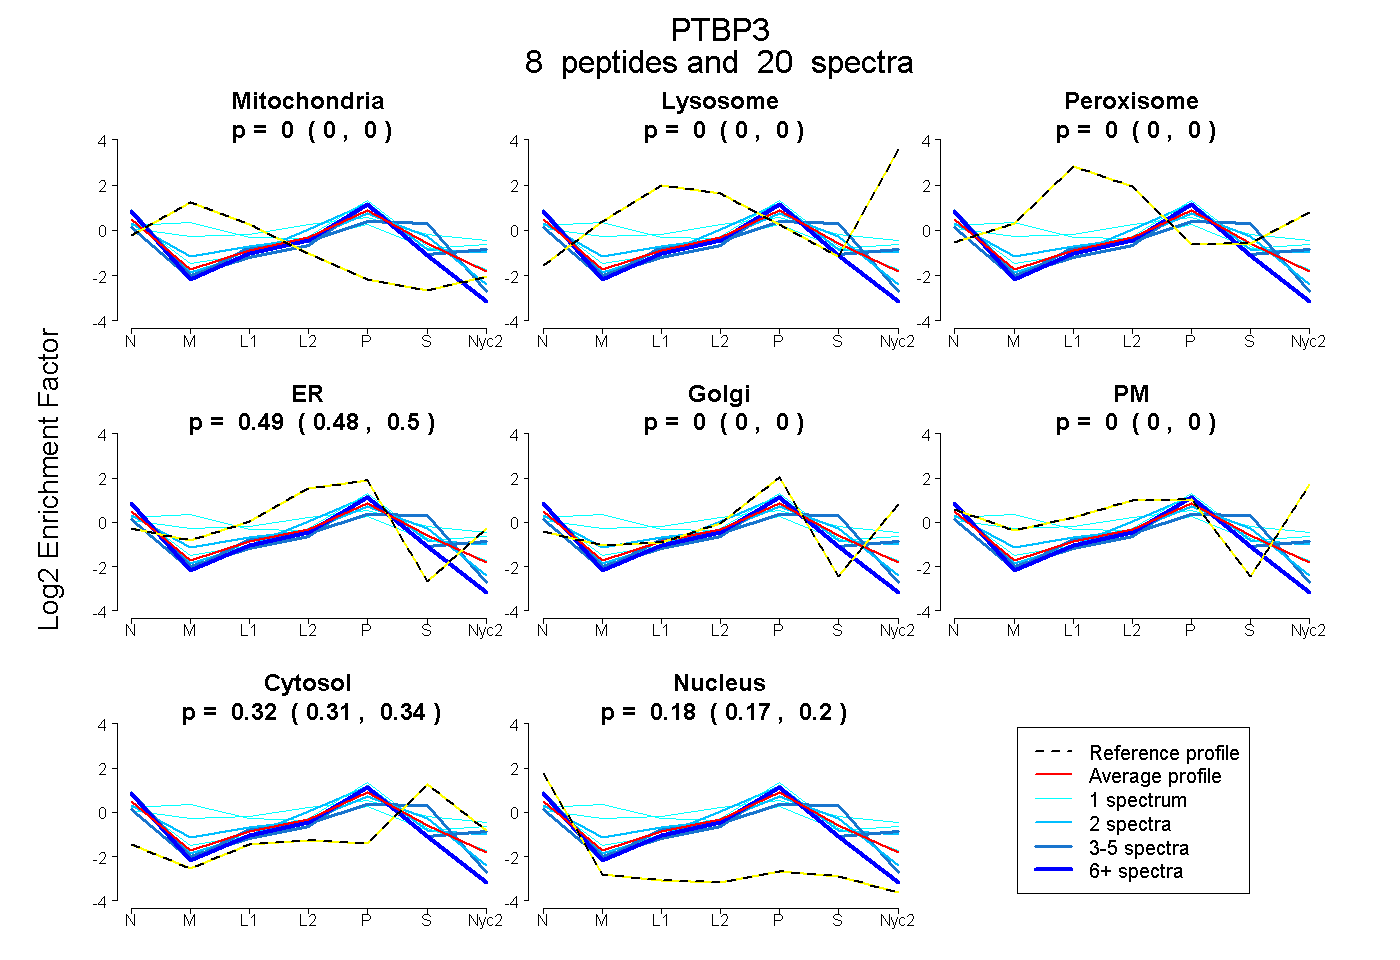 |
0.000
0.000 | 0.000 |
0.000
0.000 | 0.000 |
|
0.000
0.000 | 0.000 |
0.491
0.480 | 0.501 |
0.000
0.000 | 0.000 |
0.000
0.000 | 0.000 |
0.324
0.306 | 0.339 |
0.185
0.169 | 0.198 |
|
| | | Plot |
Mito |
|
Lyso or Perox |
|
ER |
Golgi |
PM |
Cytosol |
Nucleus |
|
| Expt B |
3
peptides |
3
spectra |
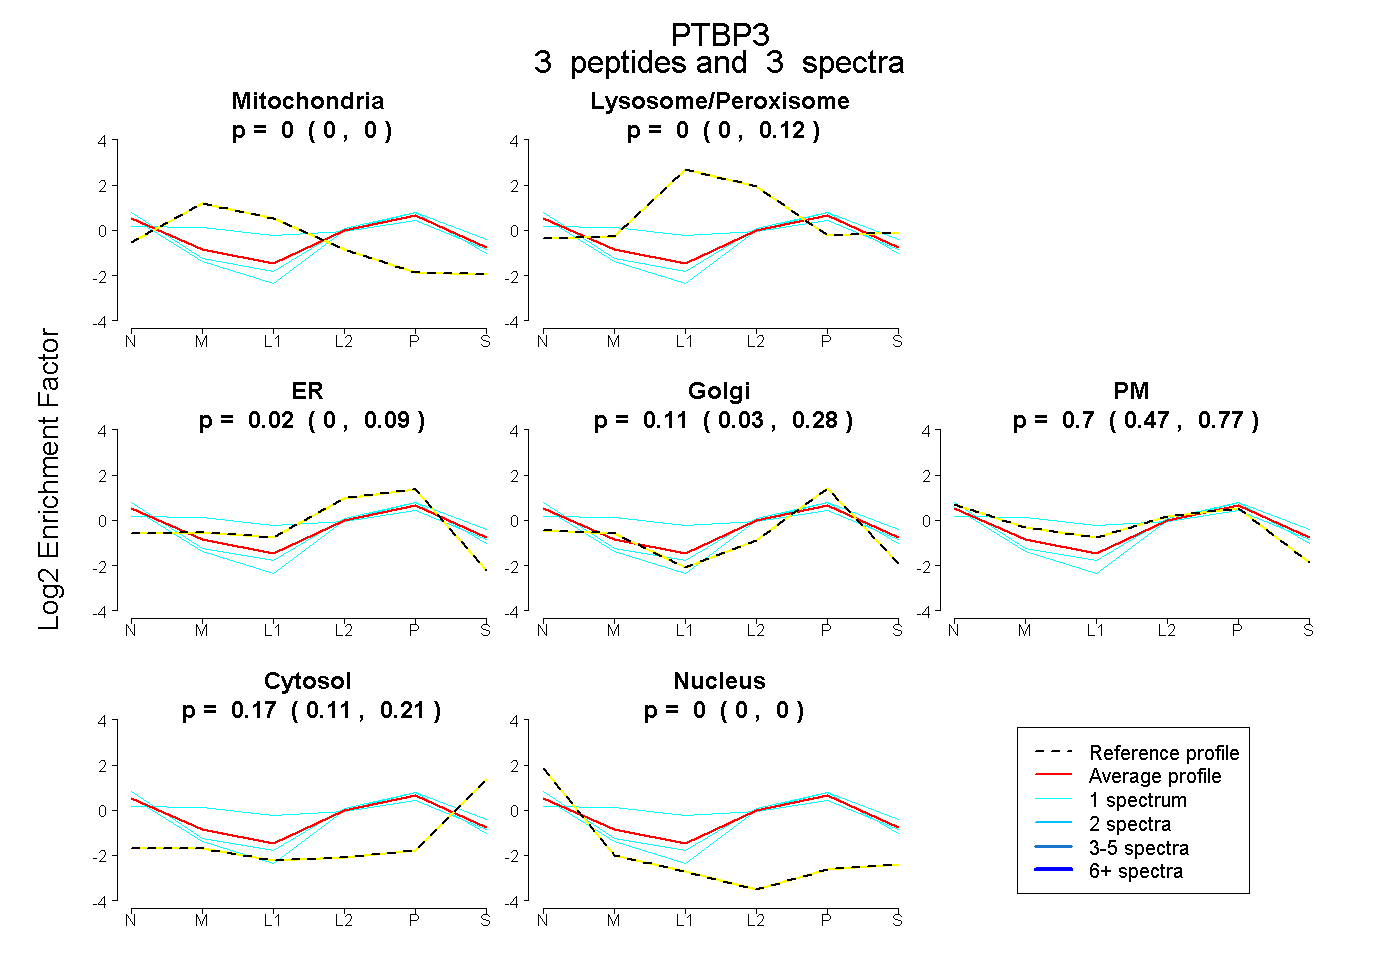 |
0.000
0.000 | 0.000 |
|
0.000
0.000 | 0.123 |
|
0.017
0.000 | 0.086 |
0.115
0.025 | 0.281 |
0.697
0.472 | 0.769 |
0.171
0.113 | 0.206 |
0.000
0.000 | 0.000 |
|
| 1 spectrum, HQAVQLPR |
0.085 |
|
0.241 |
|
0.000 |
0.223 |
0.383 |
0.068 |
0.000 |
|
| 1 spectrum, VLHIR |
0.000 |
|
0.000 |
|
0.000 |
0.335 |
0.441 |
0.225 |
0.000 |
|
| 1 spectrum, TDNLPNQAR |
0.000 |
|
0.000 |
|
0.000 |
0.229 |
0.653 |
0.113 |
0.005 |
|
| | | Plot |
|
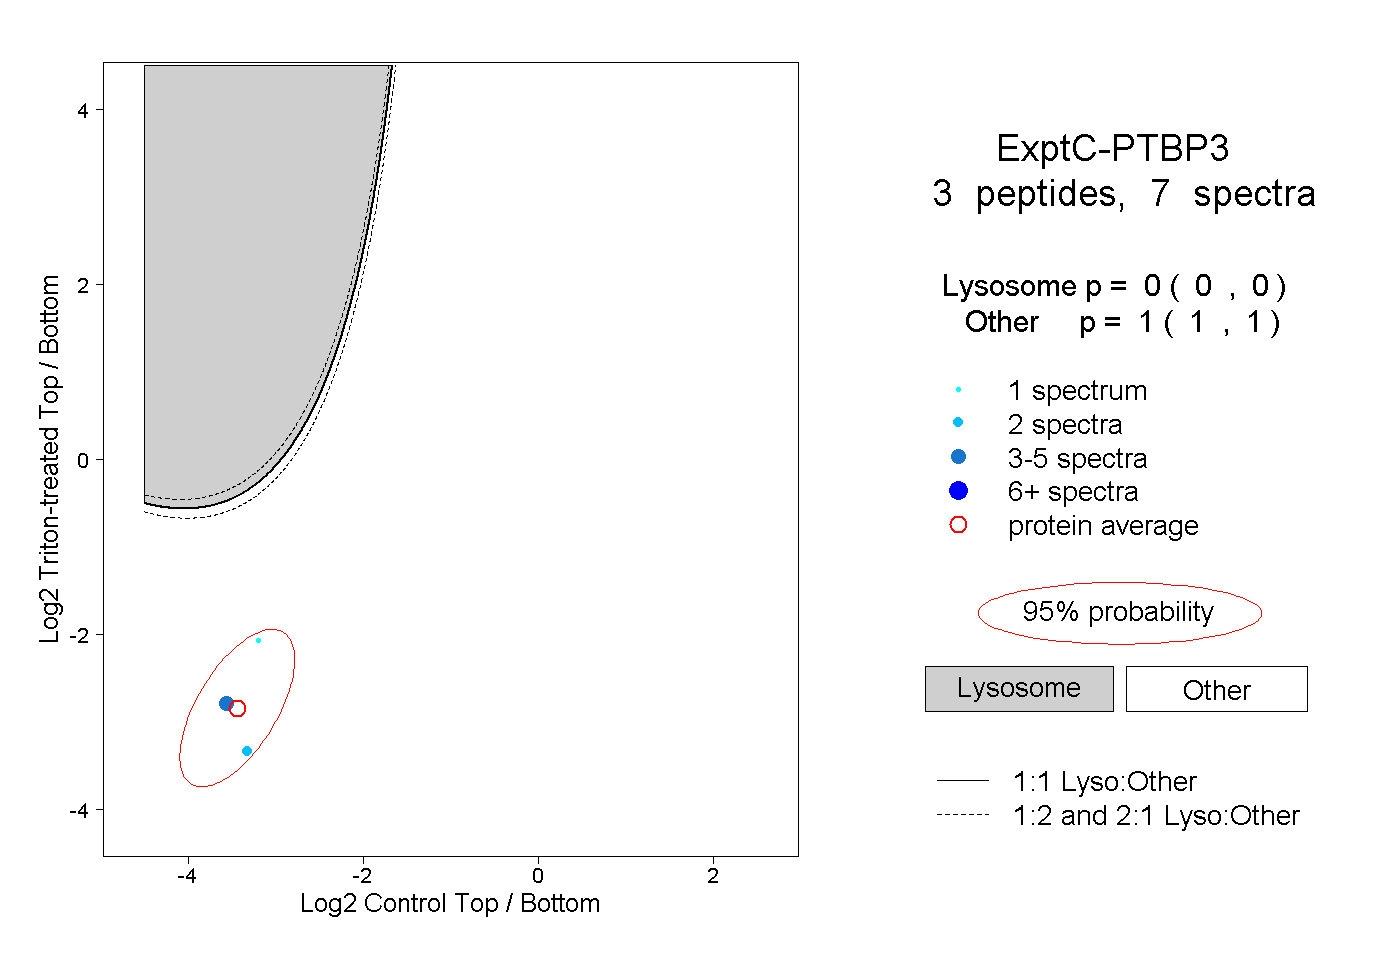
Lyso |
|
|
|
|
|
|
|
Other |
| Expt C |
3
peptides |
7
spectra |
 |
|
0.000
0.000 | 0.000 |
|
|
|
|
|
|
|
1.000
1.000 | 1.000 |
| | | Plot |
|
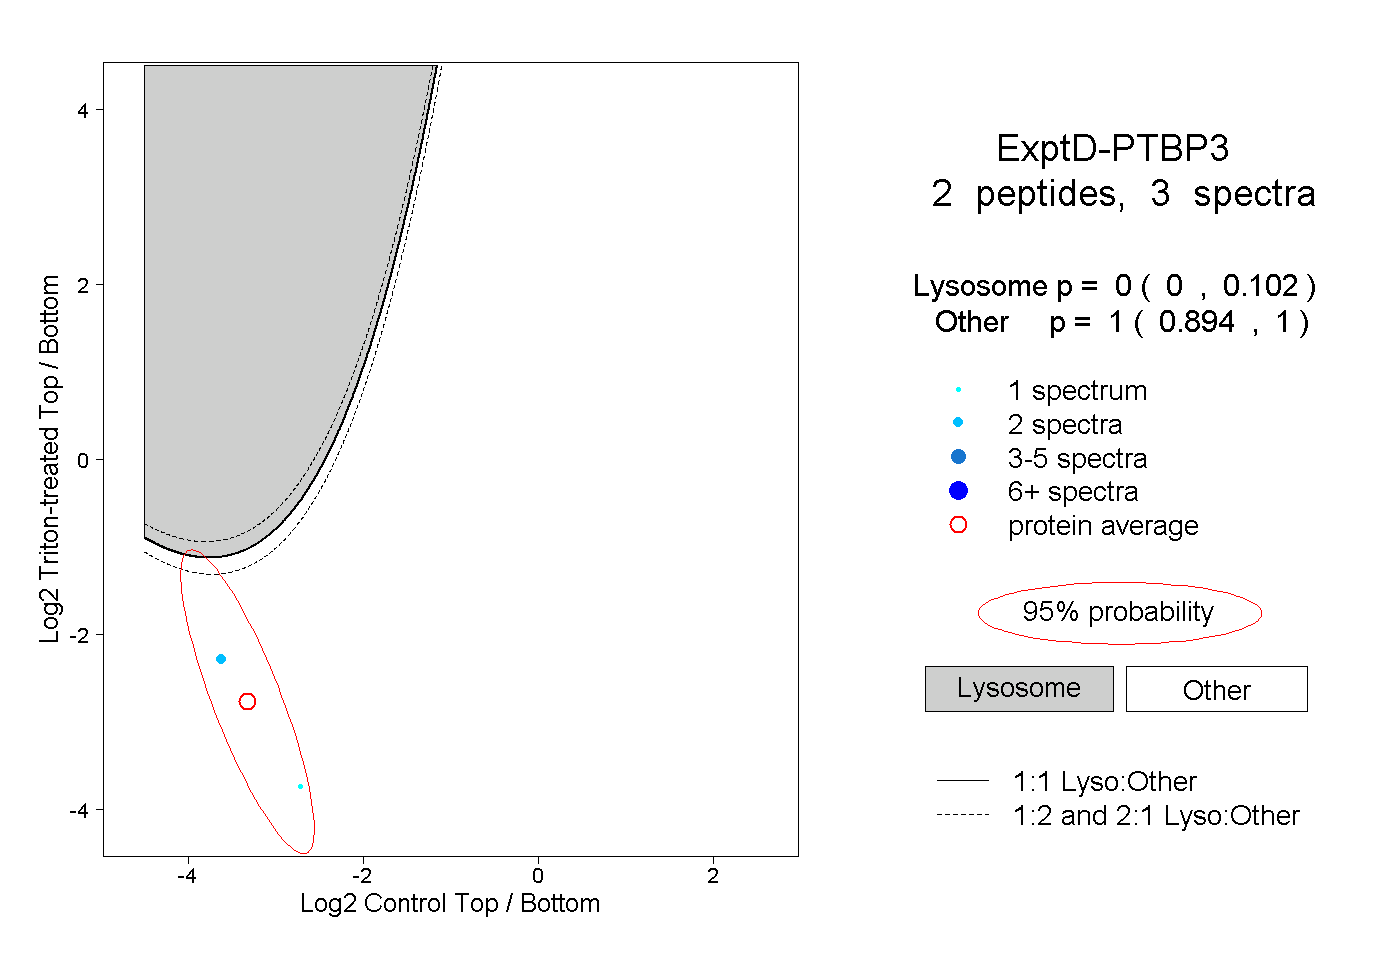
Lyso |
|
|
|
|
|
|
|
Other |
| Expt D |
2
peptides |
3
spectra |
 |
|
0.000
0.000 | 0.102 |
|
|
|
|
|
|
|
1.000
0.894 | 1.000 |