 8
8peptides
spectra
0.000 | 0.000
0.000 | 0.000
0.000 | 0.000
0.480 | 0.501
0.000 | 0.000
0.000 | 0.000
0.306 | 0.339
0.169 | 0.198
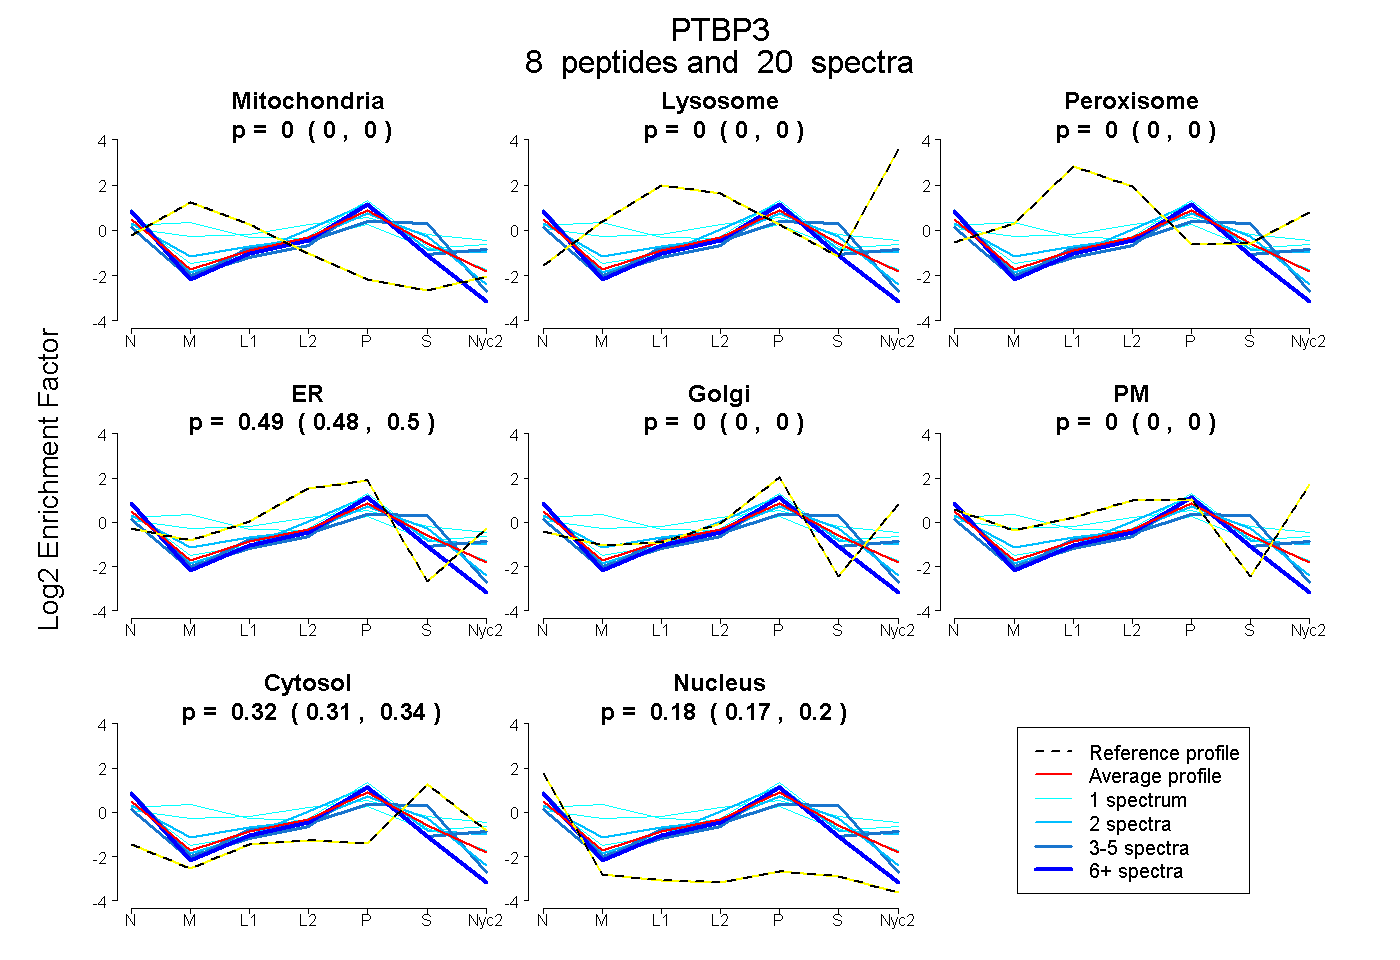
| Plot | Mito | Lyso | Perox | ER | Golgi | PM | Cytosol | Nucleus | |||||
| Expt A |
8 peptides |
20 spectra |
|
0.000 0.000 | 0.000 |
0.000 0.000 | 0.000 |
0.000 0.000 | 0.000 |
0.491 0.480 | 0.501 |
0.000 0.000 | 0.000 |
0.000 0.000 | 0.000 |
0.324 0.306 | 0.339 |
0.185 0.169 | 0.198 |
| 2 spectra, HQAVQLPR | 0.000 | 0.000 | 0.000 | 0.484 | 0.111 | 0.000 | 0.268 | 0.137 | ||
| 6 spectra, VLHIR | 0.000 | 0.000 | 0.000 | 0.493 | 0.000 | 0.000 | 0.155 | 0.352 | ||
| 1 spectrum, ENALVQMADASQAQIAMNHLSGQR | 0.316 | 0.000 | 0.113 | 0.005 | 0.303 | 0.084 | 0.180 | 0.000 | ||
| 1 spectrum, DFSNSPLHR | 0.079 | 0.000 | 0.160 | 0.267 | 0.038 | 0.125 | 0.331 | 0.000 | ||
| 3 spectra, MALDGQNIYNACCTLR | 0.000 | 0.000 | 0.000 | 0.323 | 0.000 | 0.000 | 0.505 | 0.171 | ||
| 1 spectrum, IMFNK | 0.000 | 0.000 | 0.000 | 0.552 | 0.000 | 0.000 | 0.281 | 0.168 | ||
| 4 spectra, TDNLPNQAR | 0.000 | 0.000 | 0.000 | 0.199 | 0.400 | 0.000 | 0.203 | 0.198 | ||
| 2 spectra, NLFTEAGCSVK | 0.042 | 0.000 | 0.000 | 0.444 | 0.000 | 0.000 | 0.355 | 0.159 |
| Plot | Mito | Lyso or Perox | ER | Golgi | PM | Cytosol | Nucleus | ||||||
| Expt B |
3 peptides |
3 spectra |
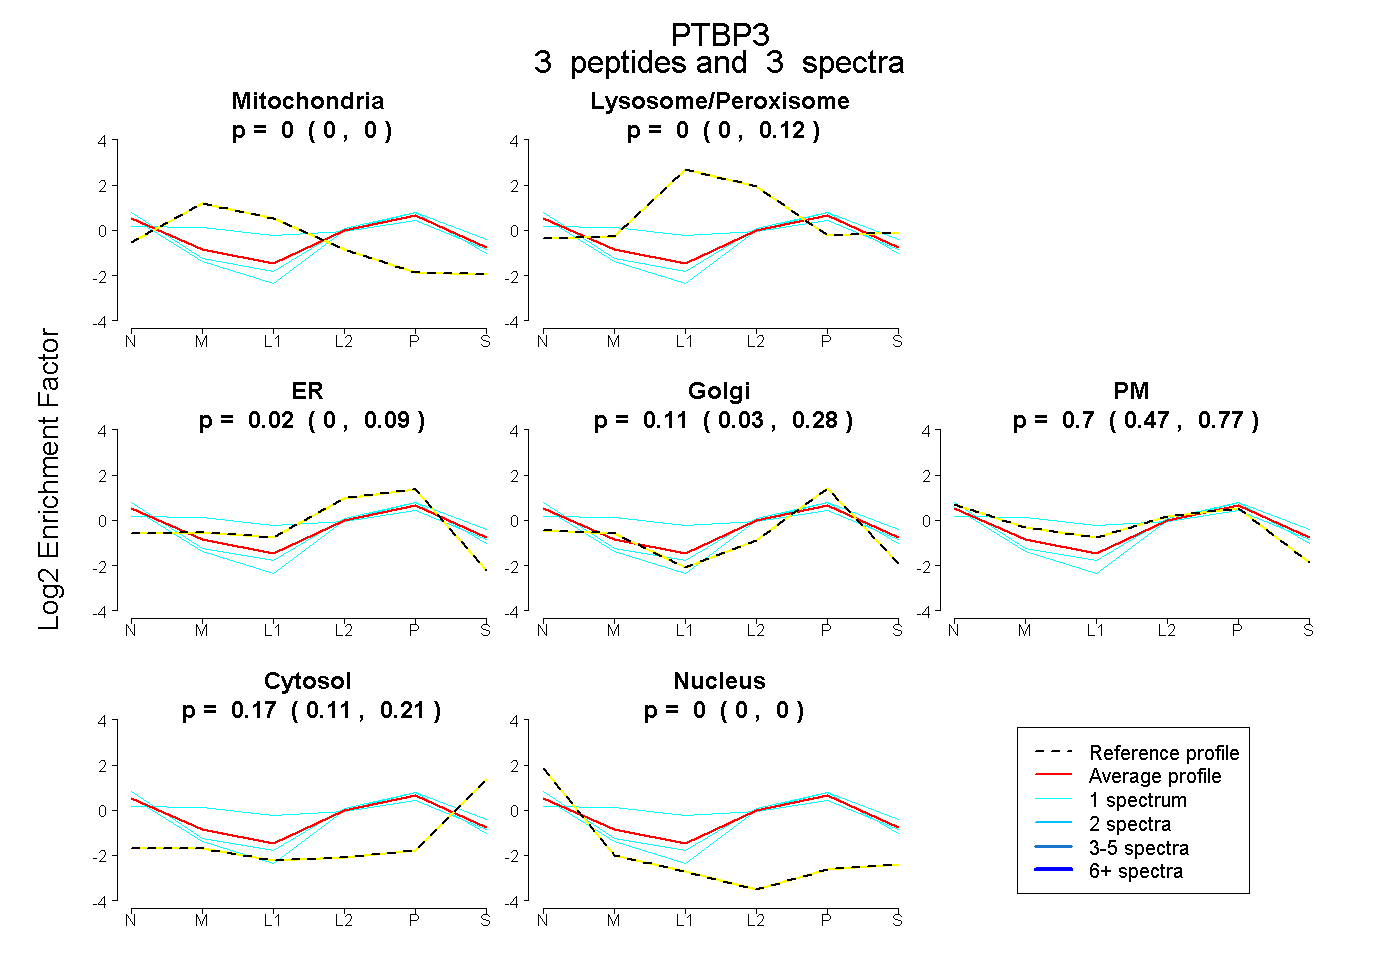 |
0.000 0.000 | 0.000 |
0.000 0.000 | 0.123 |
0.017 0.000 | 0.086 |
0.115 0.025 | 0.281 |
0.697 0.472 | 0.769 |
0.171 0.113 | 0.206 |
0.000 0.000 | 0.000 |
|||
| Plot | Lyso | Other | |||||||||||
| Expt C |
3 peptides |
7 spectra |
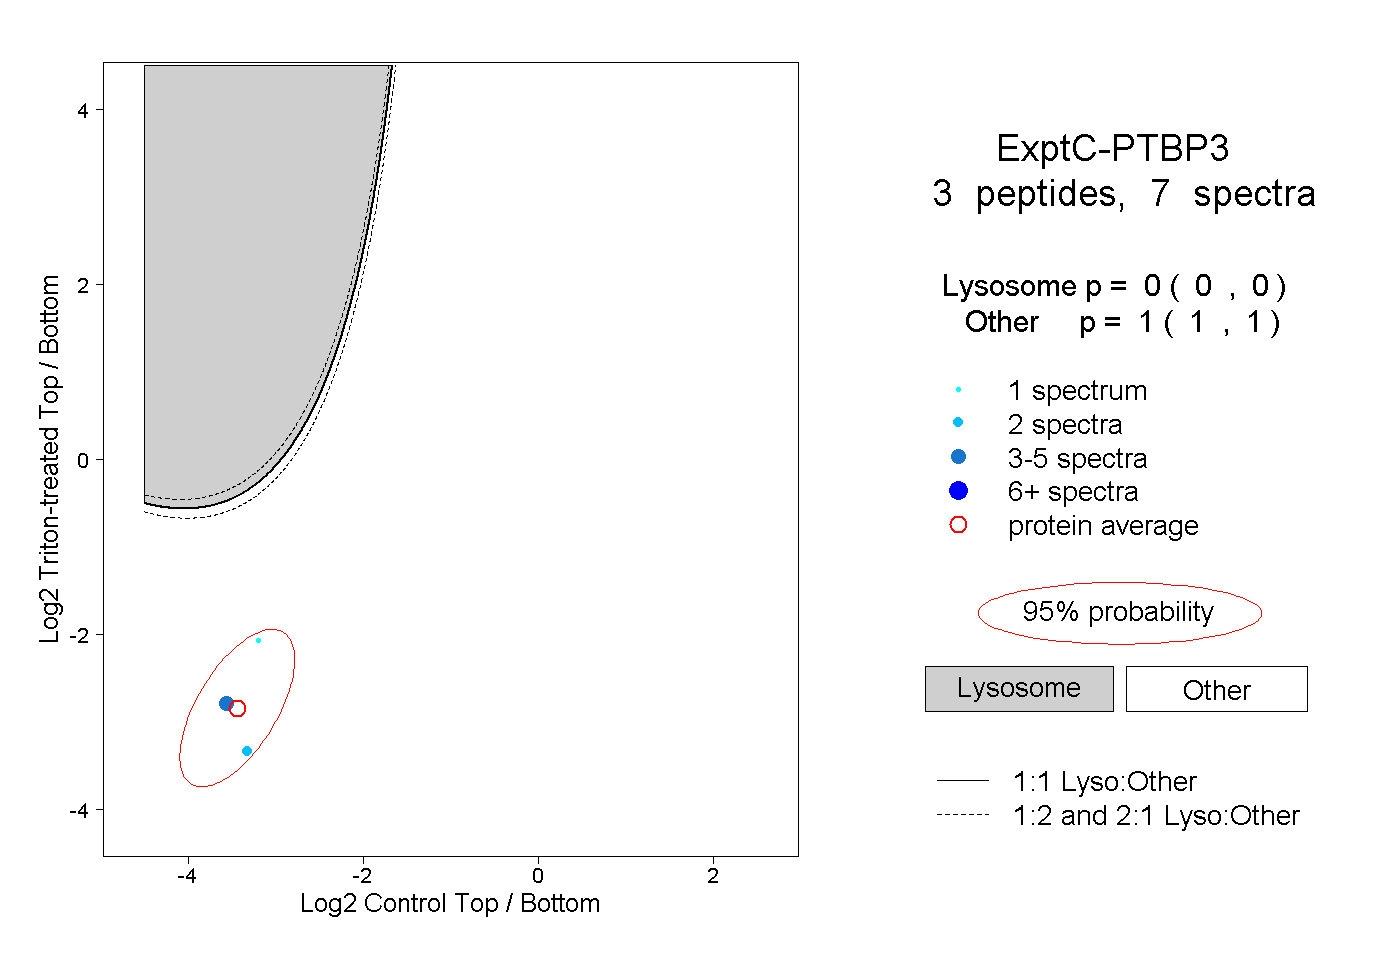 |
0.000 0.000 | 0.000 |
1.000 1.000 | 1.000 |
||||||||
| Plot | Lyso | Other | |||||||||||
| Expt D |
2 peptides |
3 spectra |
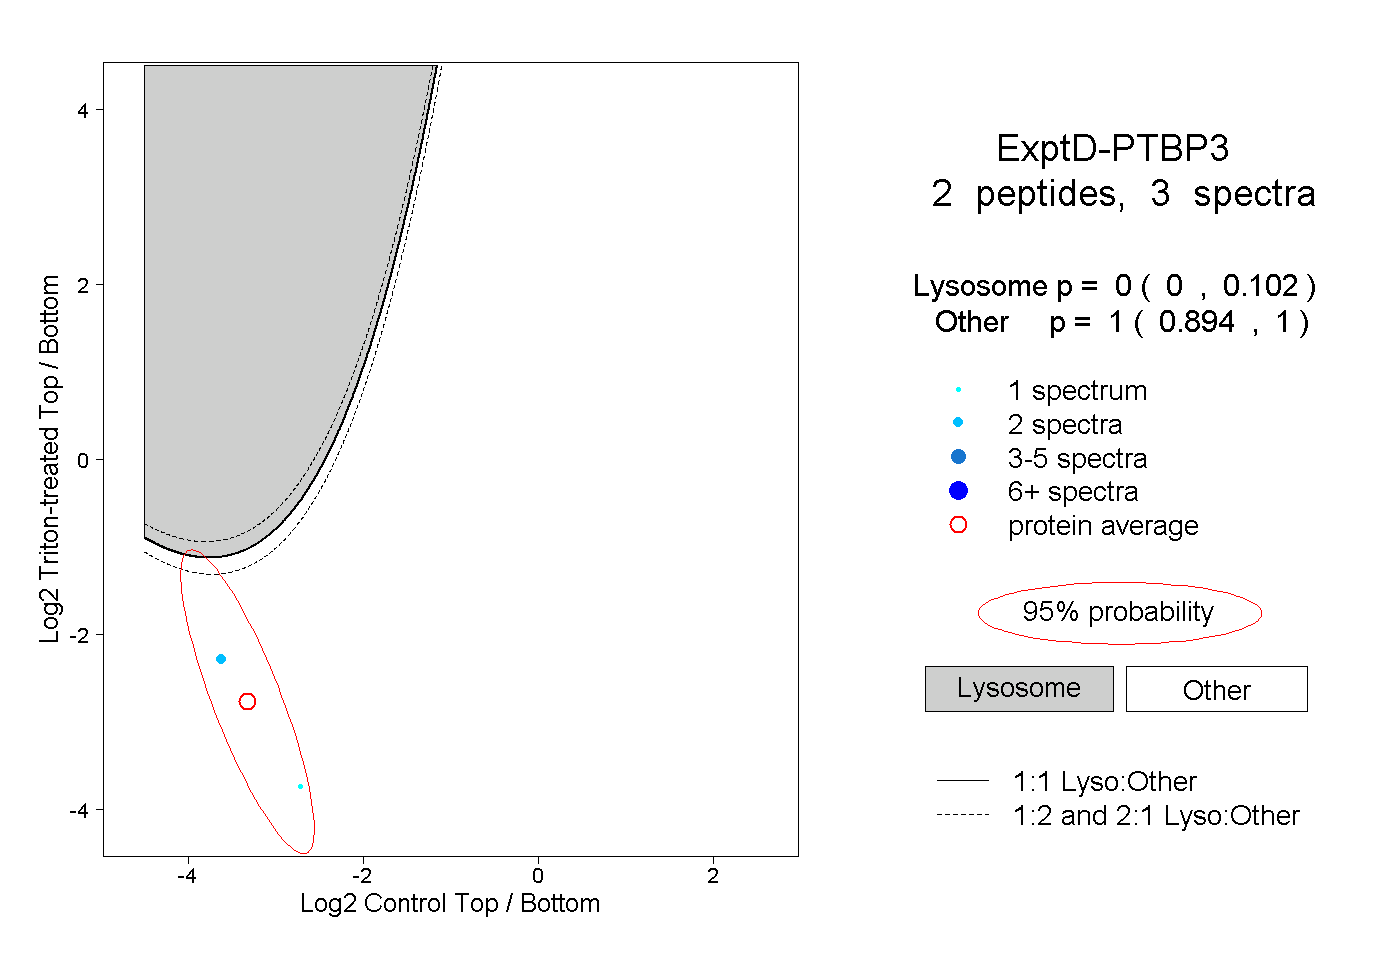 |
0.000 0.000 | 0.102 |
1.000 0.894 | 1.000 |