9
9peptides
spectra
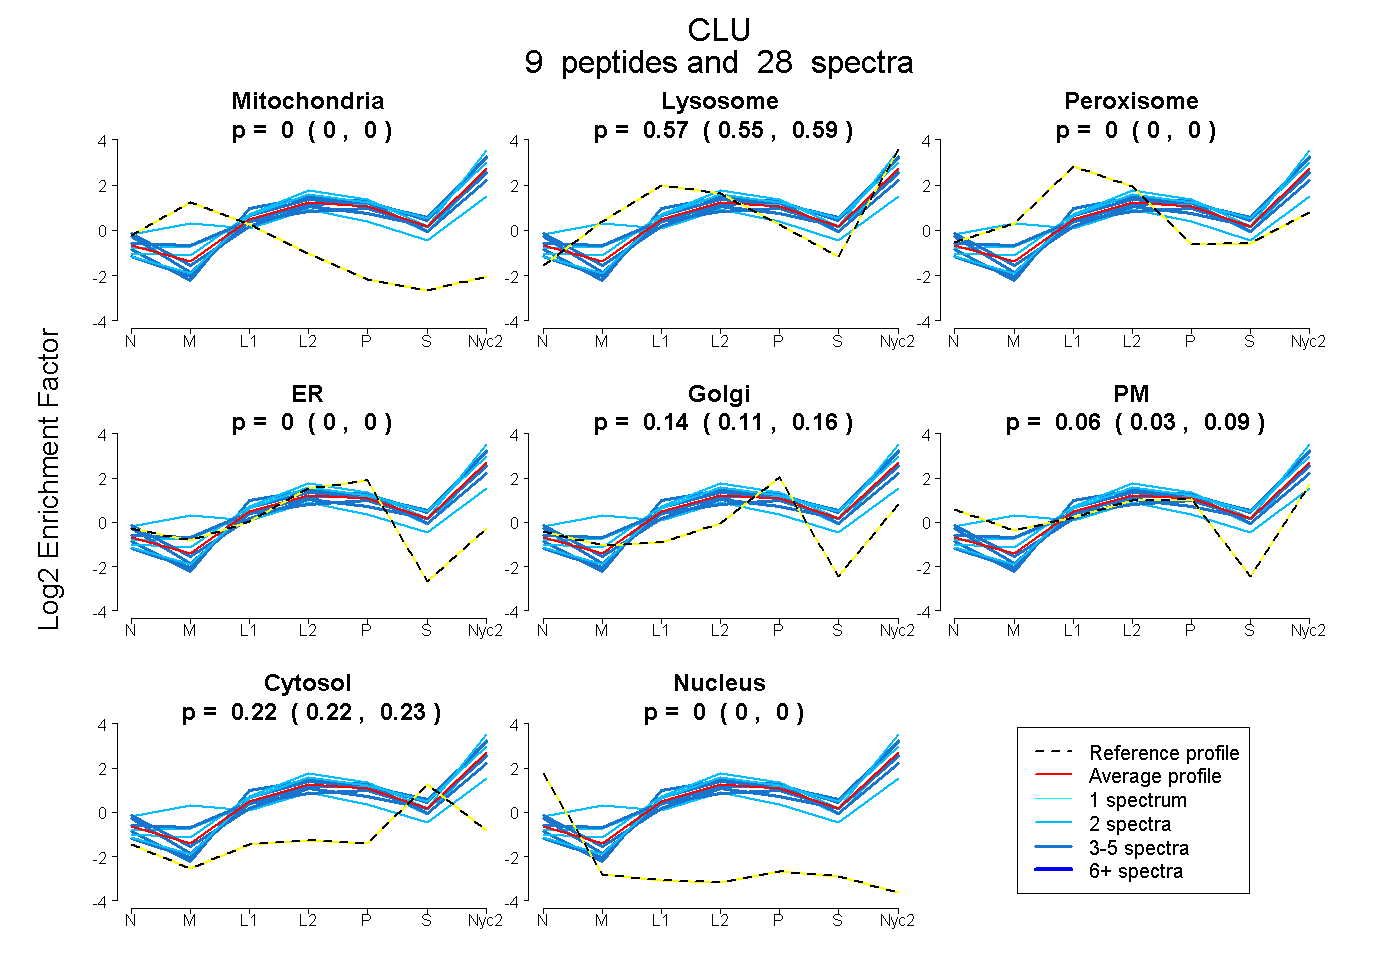
0.000 | 0.000
0.554 | 0.586
0.000 | 0.000
0.000 | 0.000
0.113 | 0.160
0.032 | 0.092
0.216 | 0.233
0.000 | 0.000
7peptides
spectra
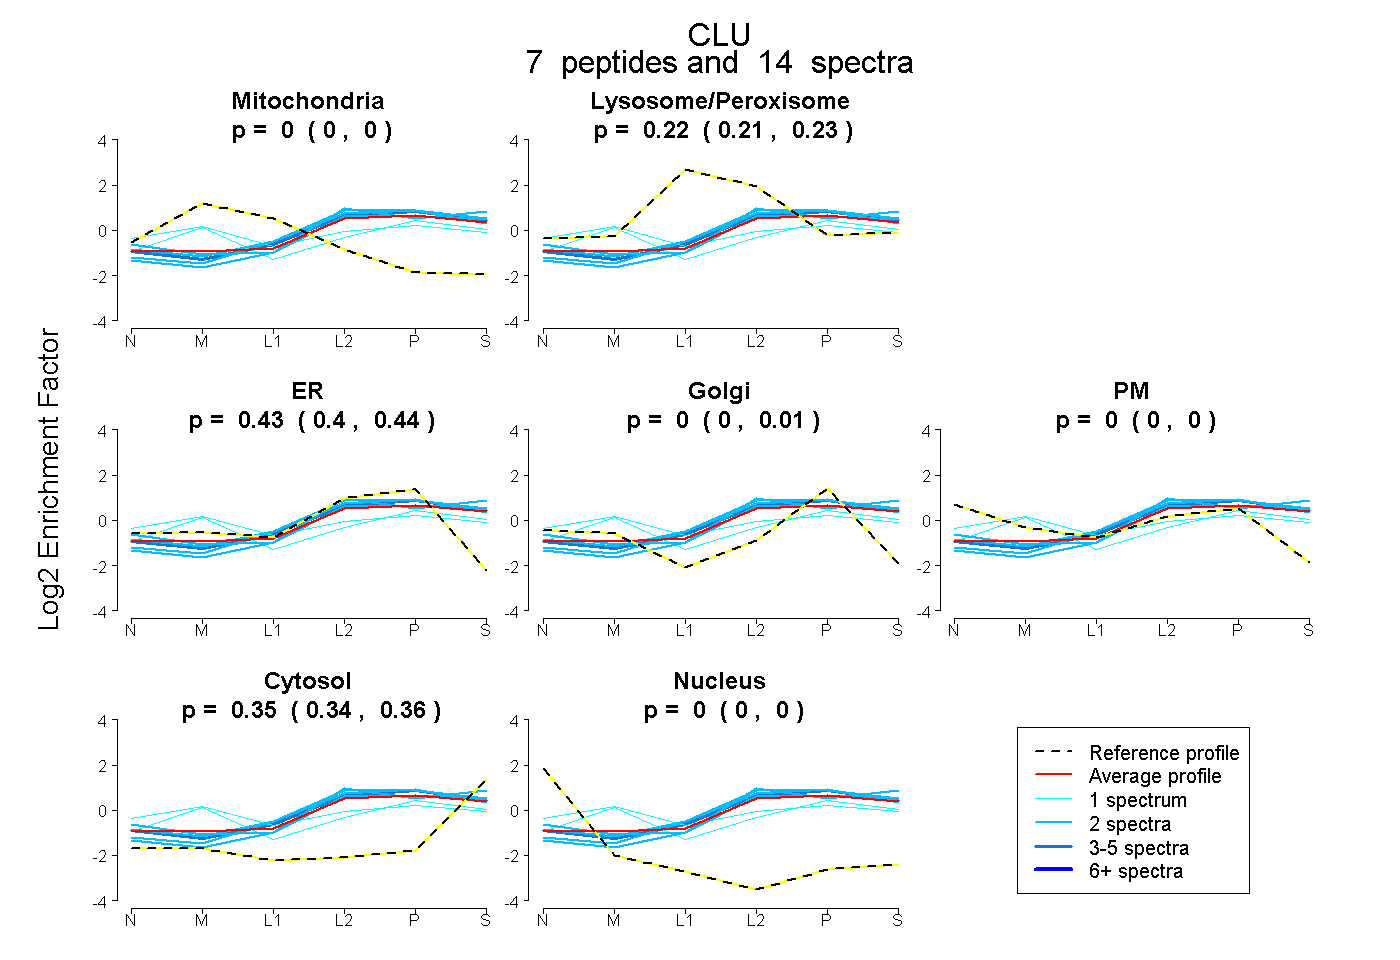
0.000 | 0.000
0.208 | 0.234
0.398 | 0.439
0.000 | 0.013
0.000 | 0.000
0.339 | 0.363
0.000 | 0.000