 9
9peptides
spectra
0.000 | 0.000
0.554 | 0.586
0.000 | 0.000
0.000 | 0.000
0.113 | 0.160
0.032 | 0.092
0.216 | 0.233
0.000 | 0.000
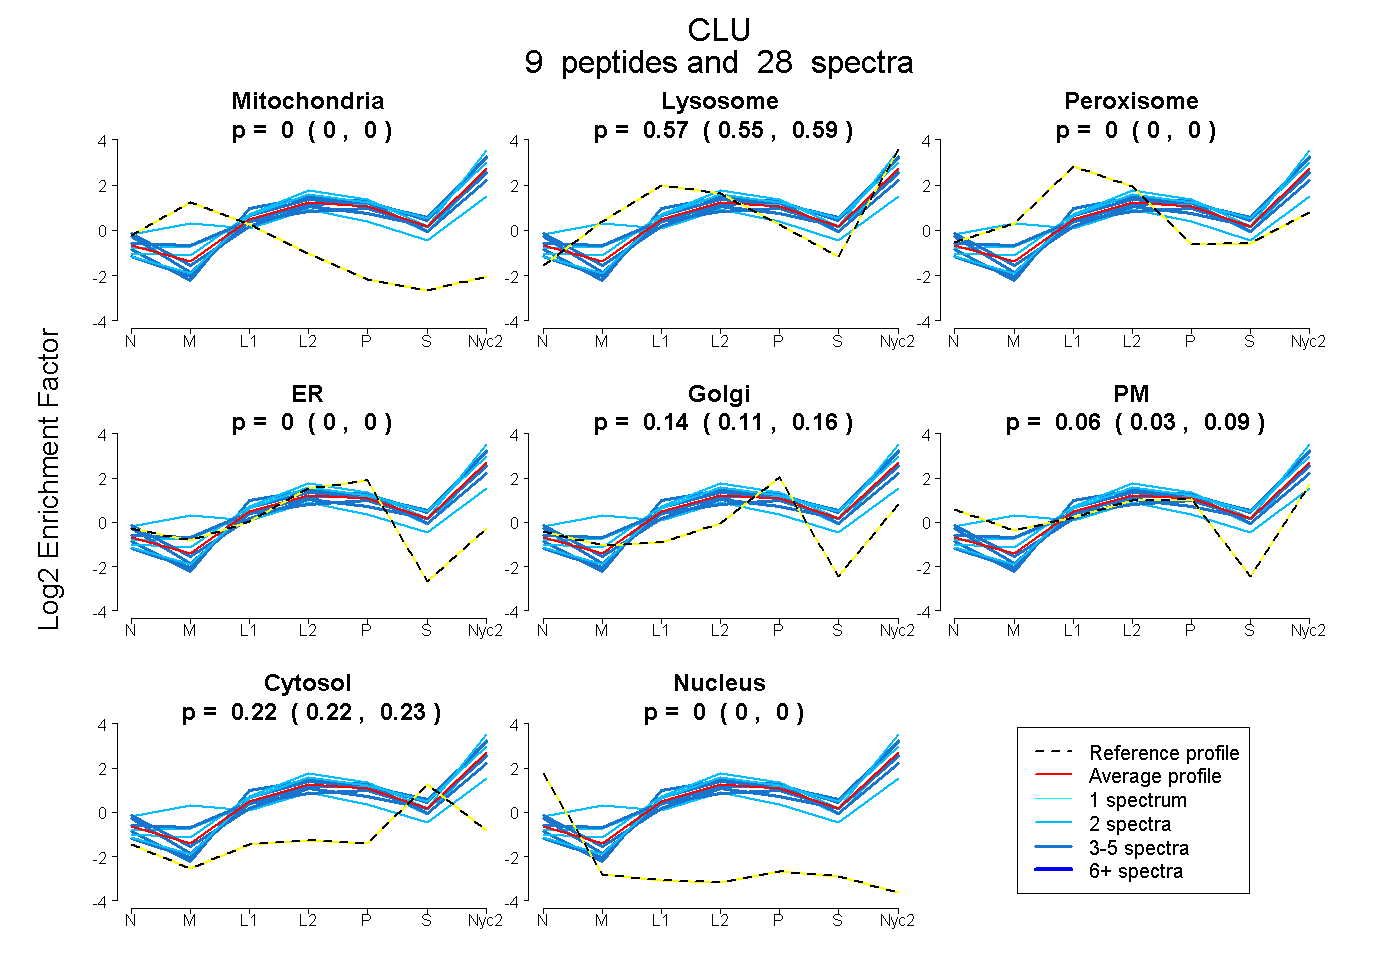
| Plot | Mito | Lyso | Perox | ER | Golgi | PM | Cytosol | Nucleus | |||||
| Expt A |
9 peptides |
28 spectra |
|
0.000 0.000 | 0.000 |
0.572 0.554 | 0.586 |
0.000 0.000 | 0.000 |
0.000 0.000 | 0.000 |
0.139 0.113 | 0.160 |
0.064 0.032 | 0.092 |
0.225 0.216 | 0.233 |
0.000 0.000 | 0.000 |
| 4 spectra, QQSQVLDAMQDSFTR | 0.000 | 0.401 | 0.000 | 0.000 | 0.000 | 0.316 | 0.283 | 0.000 | ||
| 2 spectra, ALQEYR | 0.005 | 0.243 | 0.106 | 0.000 | 0.000 | 0.435 | 0.210 | 0.000 | ||
| 2 spectra, FMDTVAEK | 0.000 | 0.597 | 0.000 | 0.000 | 0.247 | 0.000 | 0.156 | 0.000 | ||
| 2 spectra, VTEVVVK | 0.000 | 0.654 | 0.000 | 0.000 | 0.097 | 0.000 | 0.249 | 0.000 | ||
| 3 spectra, RPHFLYPK | 0.000 | 0.508 | 0.000 | 0.012 | 0.190 | 0.107 | 0.181 | 0.000 | ||
| 2 spectra, IDSLLESDR | 0.000 | 0.748 | 0.000 | 0.000 | 0.136 | 0.000 | 0.116 | 0.000 | ||
| 4 spectra, ASGIIDTLFQDR | 0.000 | 0.678 | 0.000 | 0.000 | 0.097 | 0.000 | 0.225 | 0.000 | ||
| 5 spectra, SLLNSLEEAK | 0.000 | 0.415 | 0.000 | 0.000 | 0.053 | 0.245 | 0.287 | 0.000 | ||
| 4 spectra, EGALDDTR | 0.000 | 0.663 | 0.000 | 0.000 | 0.075 | 0.000 | 0.262 | 0.000 |
| Plot | Mito | Lyso or Perox | ER | Golgi | PM | Cytosol | Nucleus | ||||||
| Expt B |
7 peptides |
14 spectra |
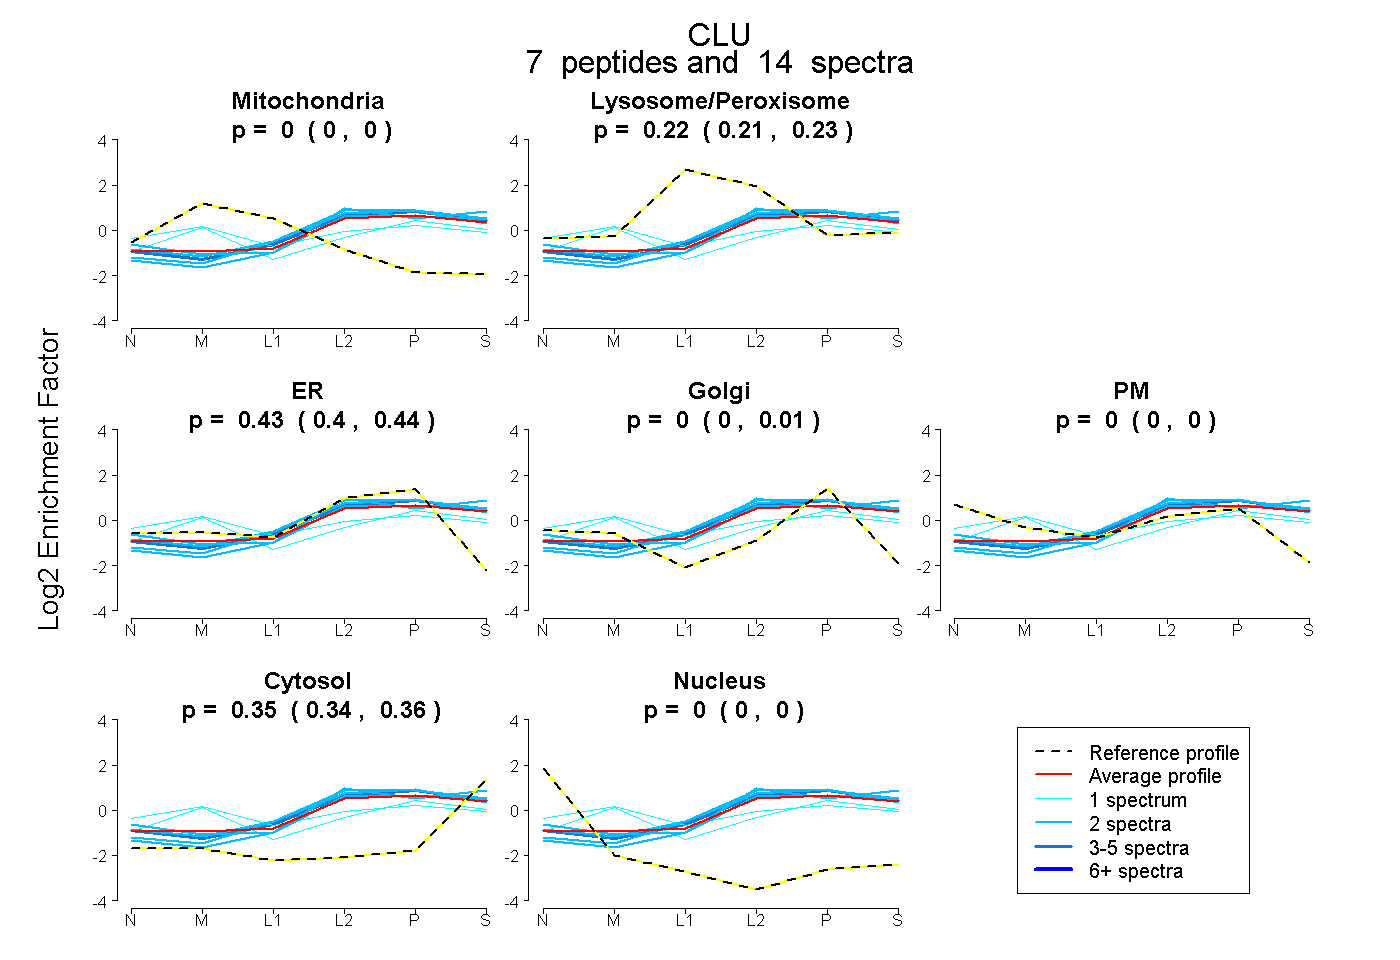 |
0.000 0.000 | 0.000 |
0.222 0.208 | 0.234 |
0.426 0.398 | 0.439 |
0.000 0.000 | 0.013 |
0.000 0.000 | 0.000 |
0.353 0.339 | 0.363 |
0.000 0.000 | 0.000 |
|||
| Plot | Lyso | Other | |||||||||||
| Expt C |
12 peptides |
84 spectra |
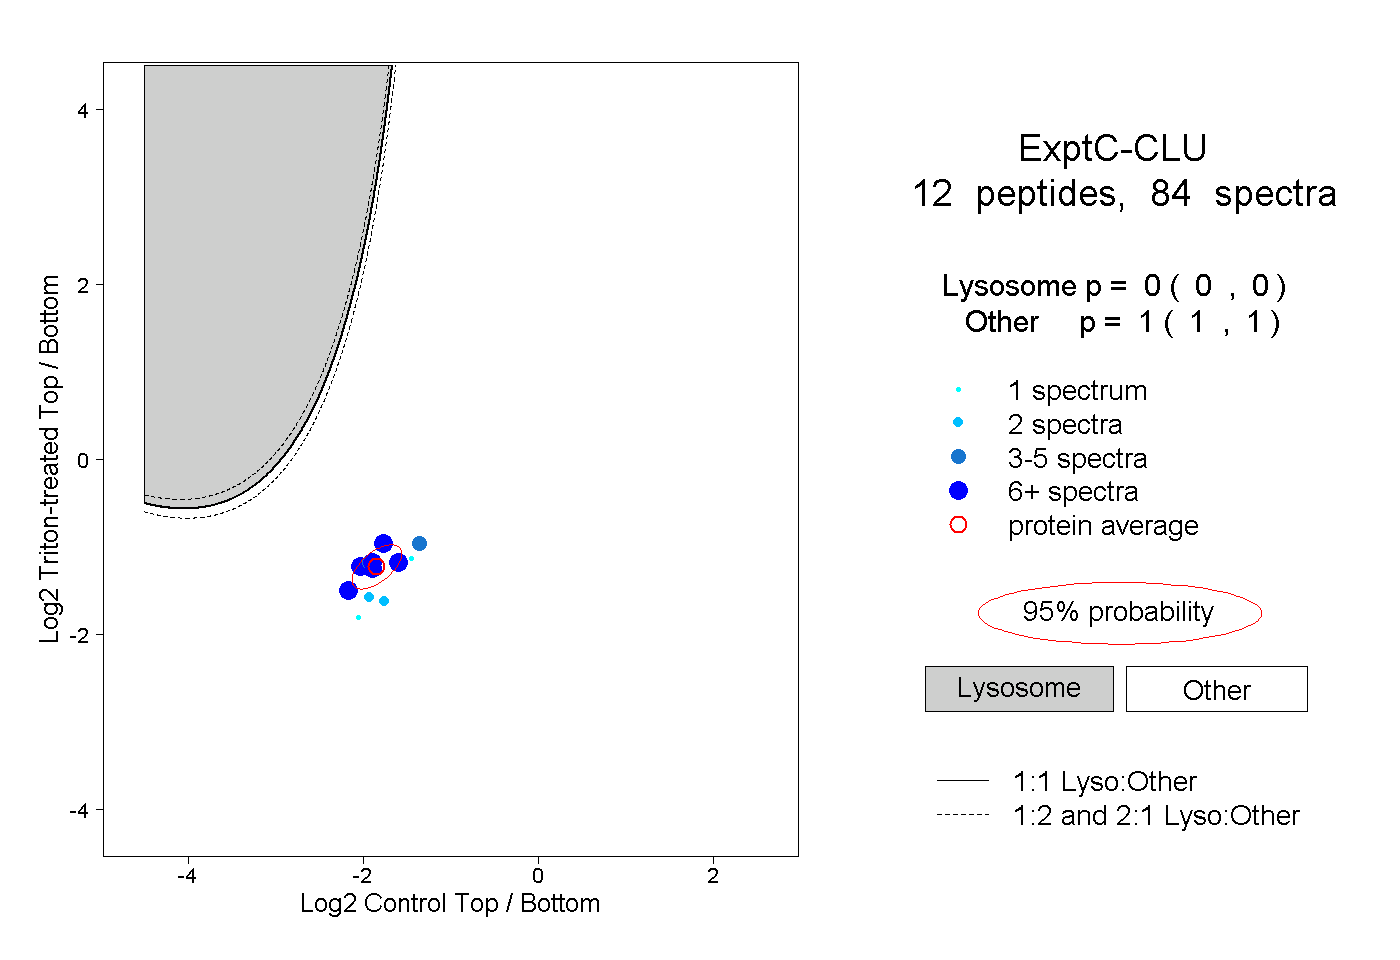 |
0.000 0.000 | 0.000 |
1.000 1.000 | 1.000 |
||||||||
| Plot | Lyso | Other | |||||||||||
| Expt D |
6 peptides |
11 spectra |
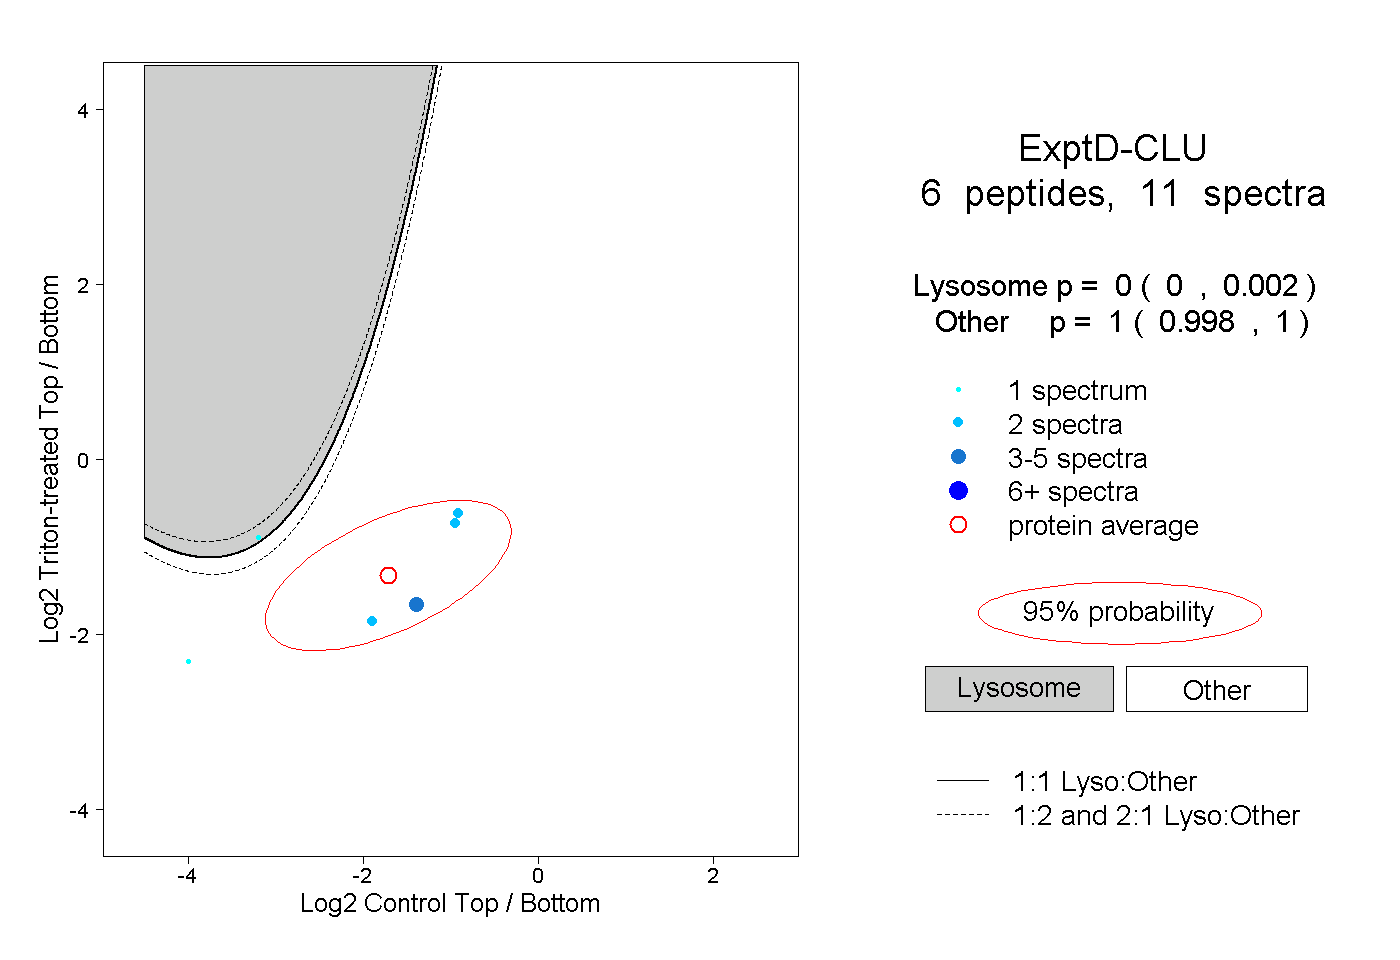 |
0.000 0.000 | 0.002 |
1.000 0.998 | 1.000 |