 2
2peptides
spectra
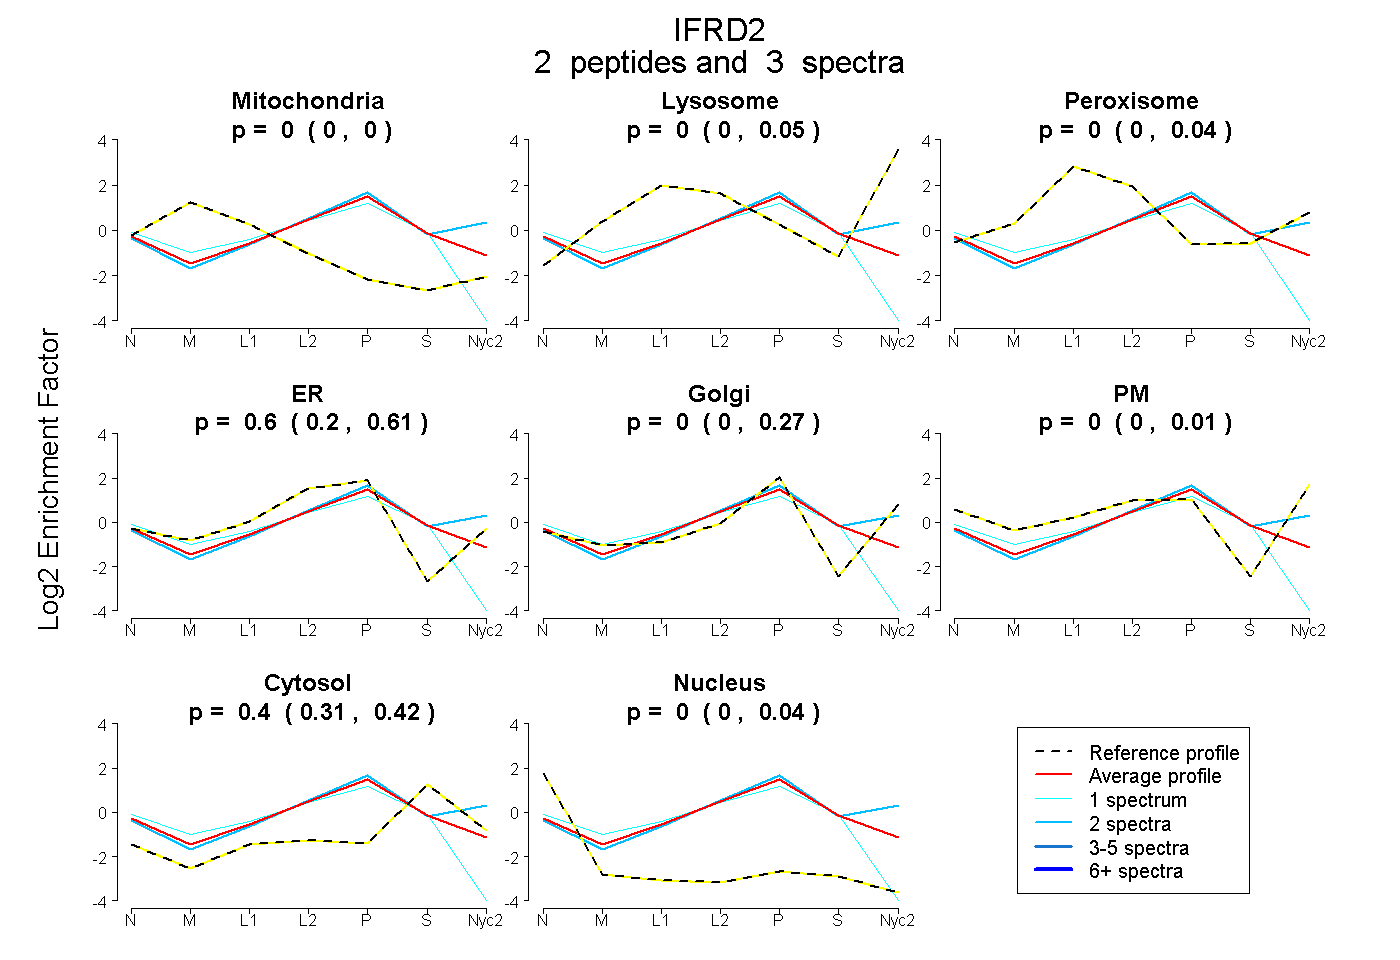
0.000 | 0.000
0.000 | 0.050
0.000 | 0.037
0.200 | 0.609
0.000 | 0.266
0.000 | 0.010
0.311 | 0.420
0.000 | 0.044
| Plot | Mito | Lyso | Perox | ER | Golgi | PM | Cytosol | Nucleus | |||||
| Expt A |
2 peptides |
3 spectra |
|
0.000 0.000 | 0.000 |
0.000 0.000 | 0.050 |
0.000 0.000 | 0.037 |
0.595 0.200 | 0.609 |
0.000 0.000 | 0.266 |
0.000 0.000 | 0.010 |
0.405 0.311 | 0.420 |
0.000 0.000 | 0.044 |
| 1 spectrum, SLTLADALEK | 0.073 | 0.000 | 0.000 | 0.489 | 0.000 | 0.000 | 0.305 | 0.133 | ||
| 2 spectra, LLPDFLLER | 0.000 | 0.062 | 0.000 | 0.303 | 0.309 | 0.000 | 0.326 | 0.000 |
| Plot | Lyso | Other | |||||||||||
| Expt C |
2 peptides |
4 spectra |
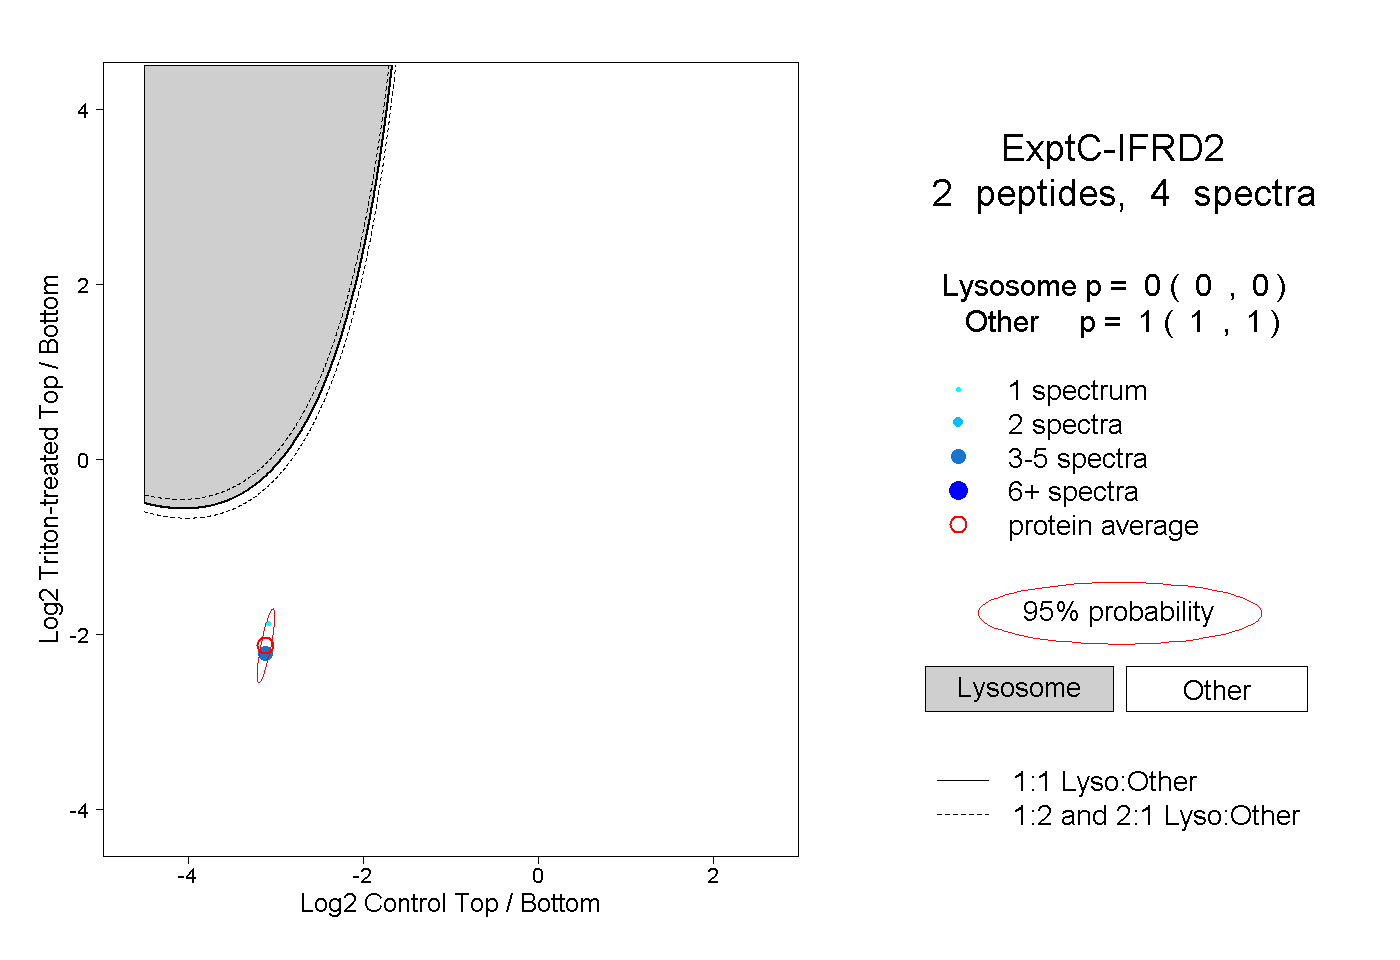 |
0.000 0.000 | 0.000 |
1.000 1.000 | 1.000 |