 7
7peptides
spectra
0.000 | 0.000
0.000 | 0.006
0.000 | 0.000
0.000 | 0.001
0.151 | 0.169
0.000 | 0.000
0.827 | 0.846
0.000 | 0.000
| Plot | Mito | Lyso | Perox | ER | Golgi | PM | Cytosol | Nucleus | |||||
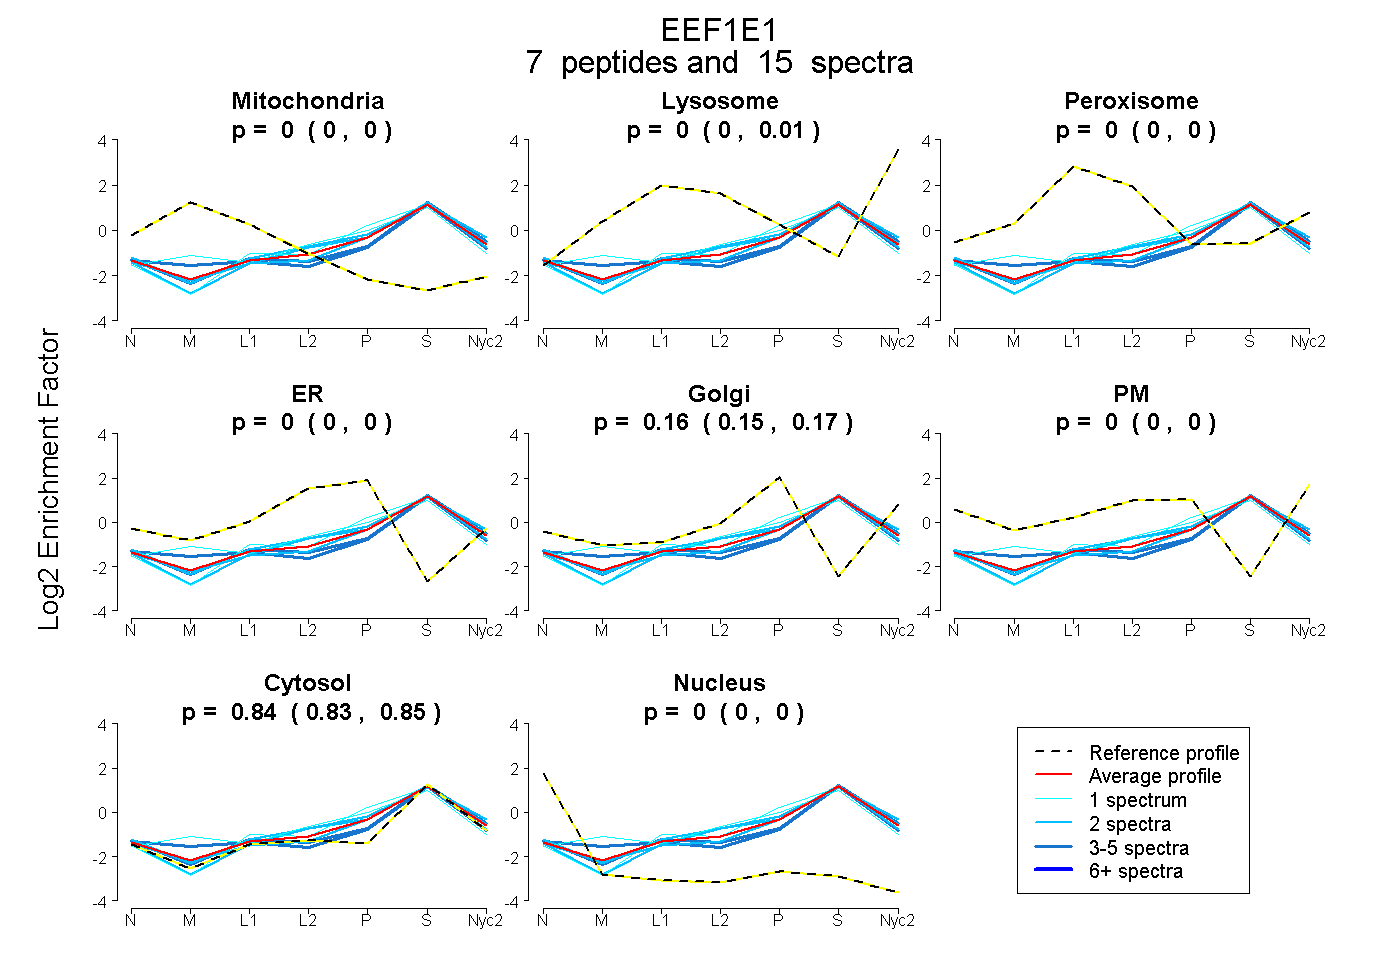
| Expt A |
7 peptides |
15 spectra |
|
0.000 0.000 | 0.000 |
0.000 0.000 | 0.006 |
0.000 0.000 | 0.000 |
0.000 0.000 | 0.001 |
0.163 0.151 | 0.169 |
0.000 0.000 | 0.000 |
0.837 0.827 | 0.846 |
0.000 0.000 | 0.000 |
| 1 spectrum, QHLSSVVFIK | 0.000 | 0.000 | 0.000 | 0.000 | 0.204 | 0.000 | 0.796 | 0.000 | ||
| 1 spectrum, WFCHIQHYPDIR | 0.006 | 0.000 | 0.000 | 0.225 | 0.012 | 0.000 | 0.757 | 0.000 | ||
| 2 spectra, SLGLKPGNK | 0.000 | 0.036 | 0.000 | 0.018 | 0.150 | 0.000 | 0.796 | 0.000 | ||
| 3 spectra, DLNSYLEDK | 0.065 | 0.000 | 0.000 | 0.000 | 0.080 | 0.000 | 0.855 | 0.000 | ||
| 2 spectra, YSAQGER | 0.000 | 0.000 | 0.000 | 0.000 | 0.147 | 0.000 | 0.853 | 0.000 | ||
| 2 spectra, LYANSH | 0.000 | 0.000 | 0.000 | 0.081 | 0.042 | 0.000 | 0.877 | 0.000 | ||
| 4 spectra, ALVQQWLEFR | 0.000 | 0.016 | 0.000 | 0.000 | 0.088 | 0.000 | 0.896 | 0.000 |
| Plot | Mito | Lyso or Perox | ER | Golgi | PM | Cytosol | Nucleus | ||||||
| Expt B |
1 peptide |
1 spectrum |
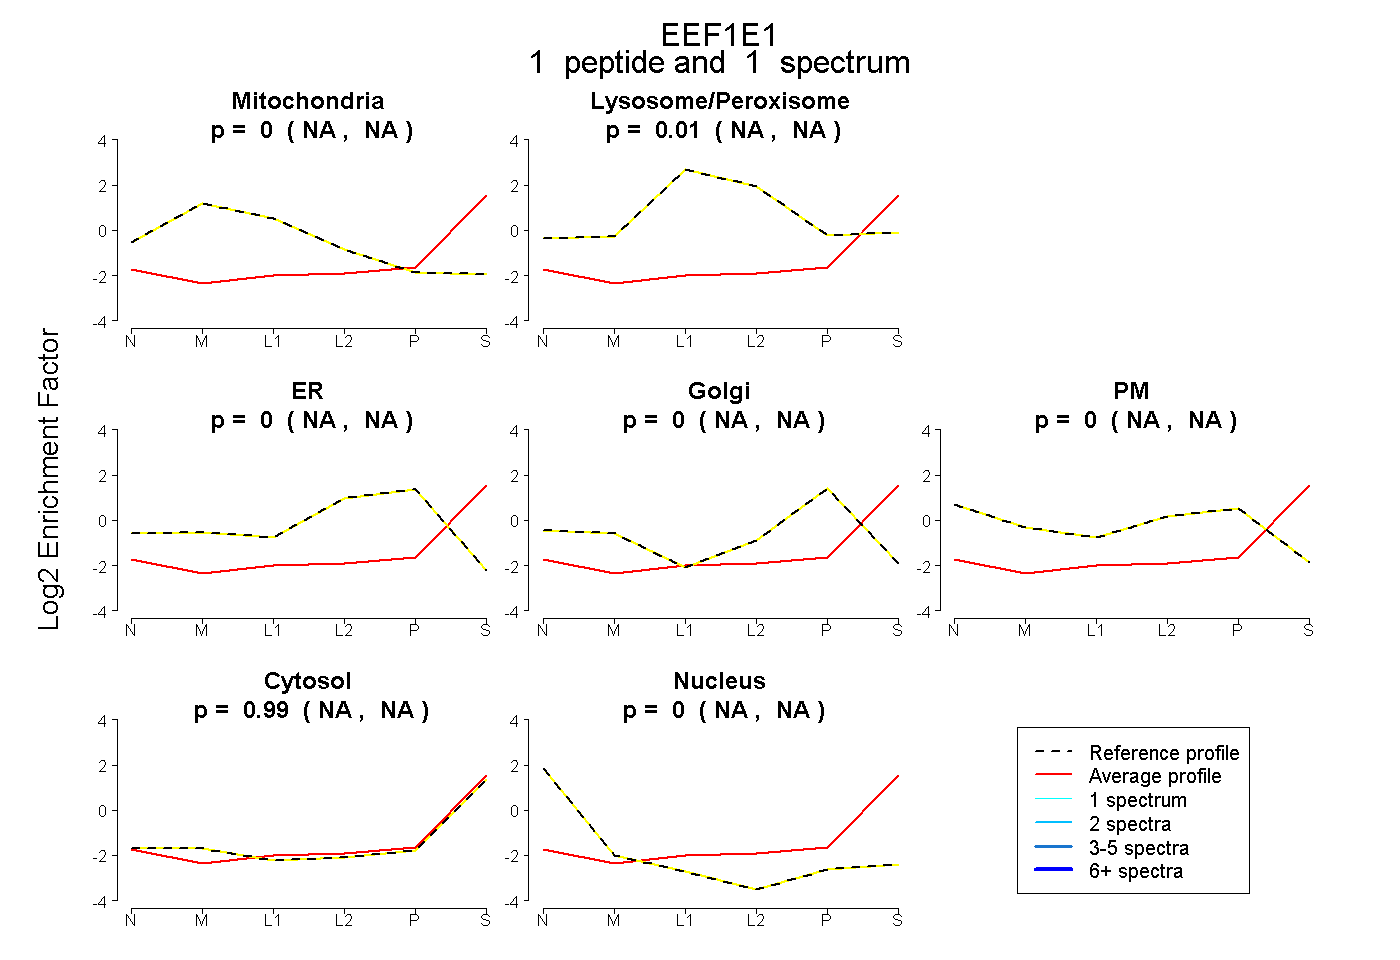 |
0.000 NA | NA |
0.014 NA | NA |
0.000 NA | NA |
0.000 NA | NA |
0.000 NA | NA |
0.986 NA | NA |
0.000 NA | NA |
|||
| Plot | Lyso | Other | |||||||||||
| Expt C |
4 peptides |
12 spectra |
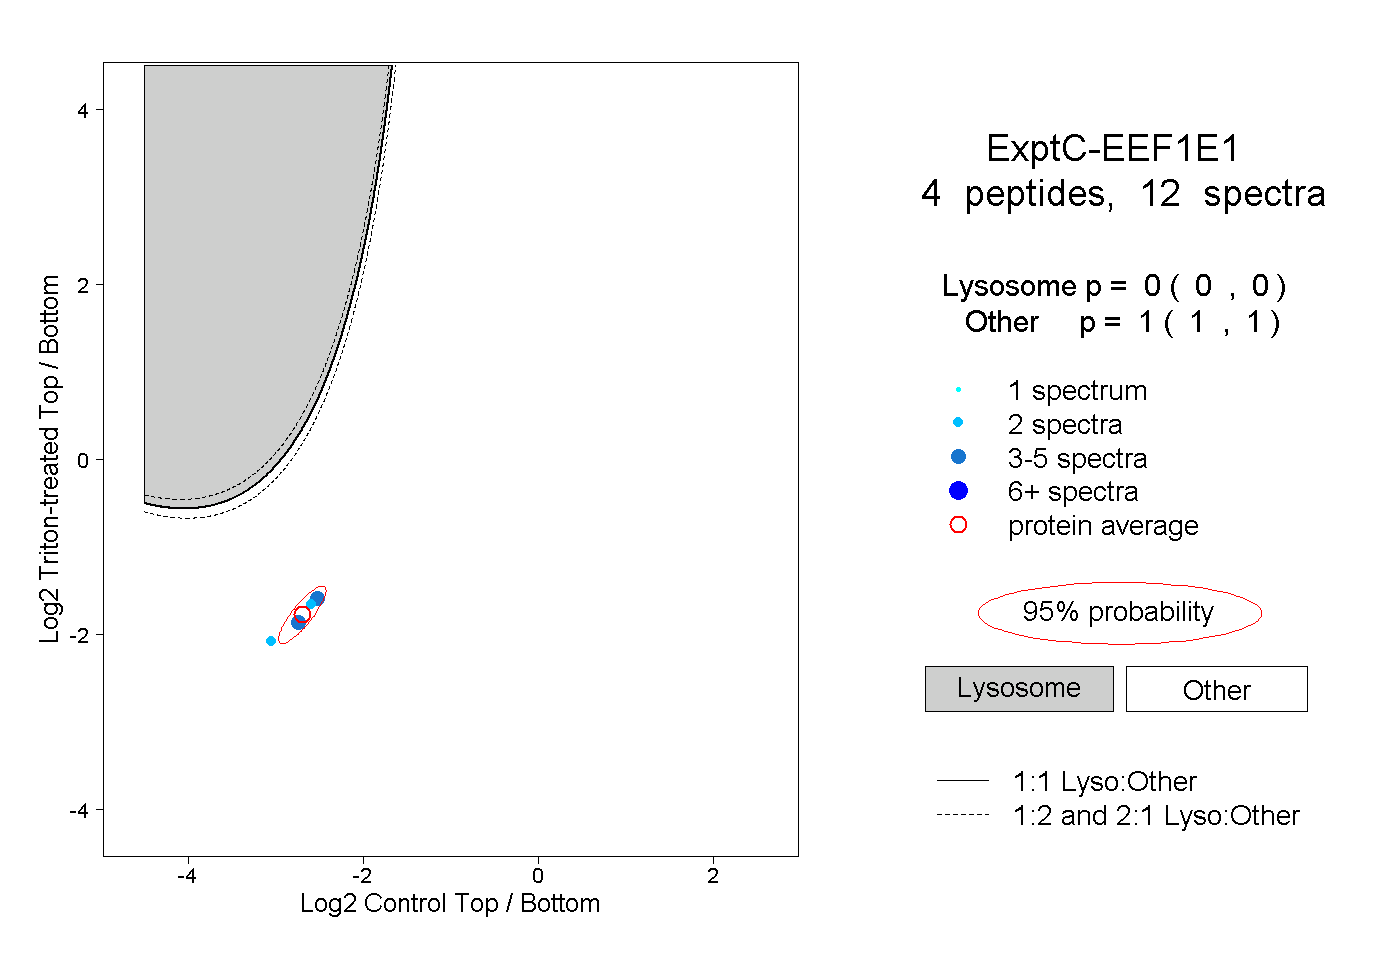 |
0.000 0.000 | 0.000 |
1.000 1.000 | 1.000 |