 1
1peptide
spectrum
NA | NA
NA | NA
NA | NA
NA | NA
NA | NA
NA | NA
NA | NA
1peptide
spectra
NA | NA
NA | NA
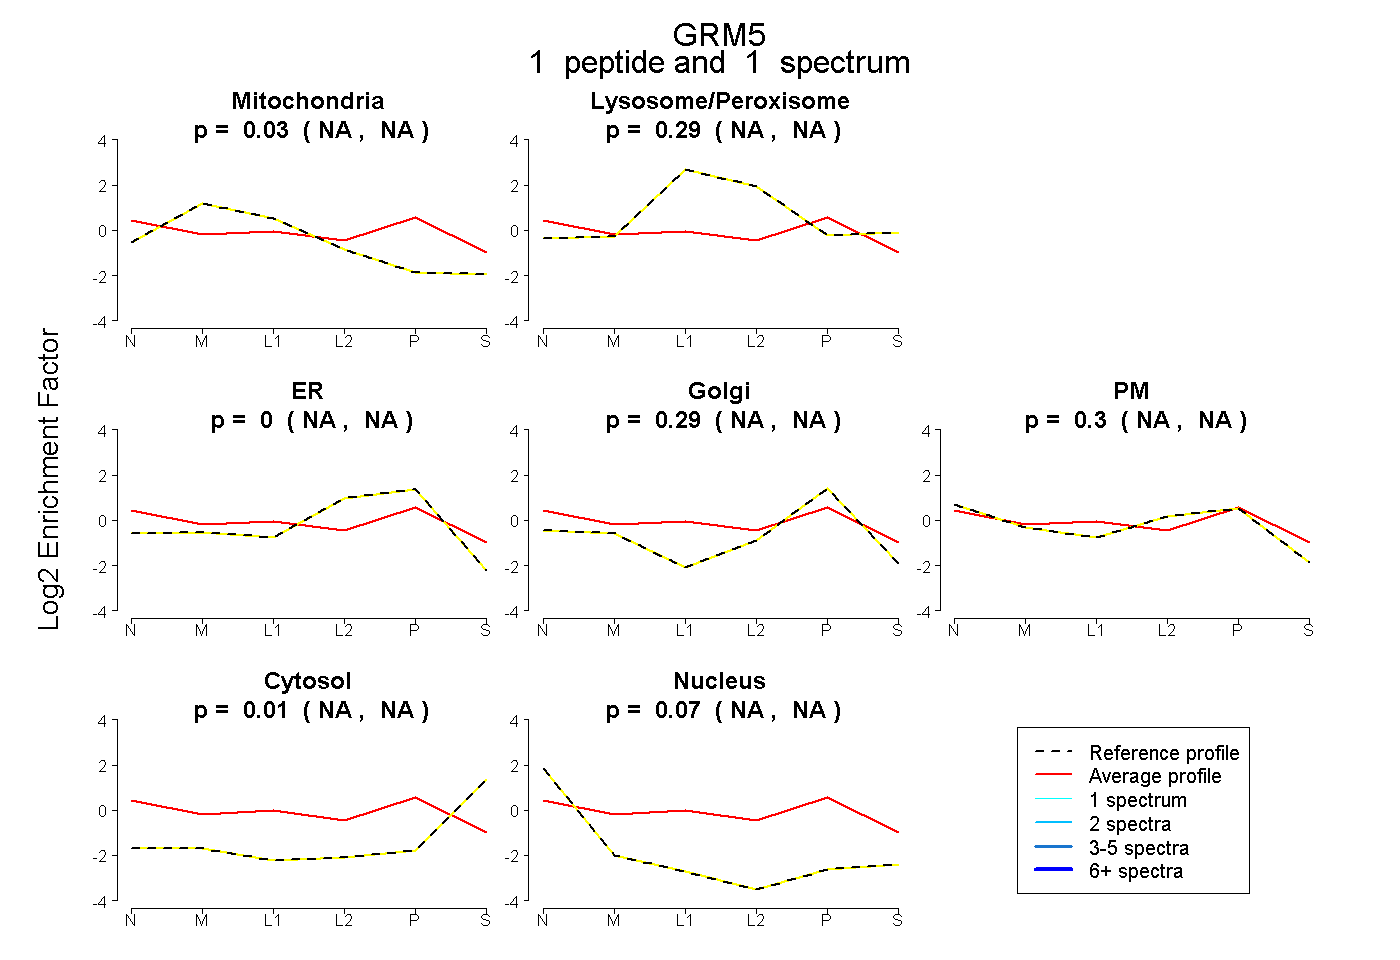
| Plot | Mito | Lyso or Perox | ER | Golgi | PM | Cytosol | Nucleus | ||||||
| Expt B |
1 peptide |
1 spectrum |
|
0.034 NA | NA |
0.289 NA | NA |
0.000 NA | NA |
0.292 NA | NA |
0.300 NA | NA |
0.014 NA | NA |
0.071 NA | NA |
|||
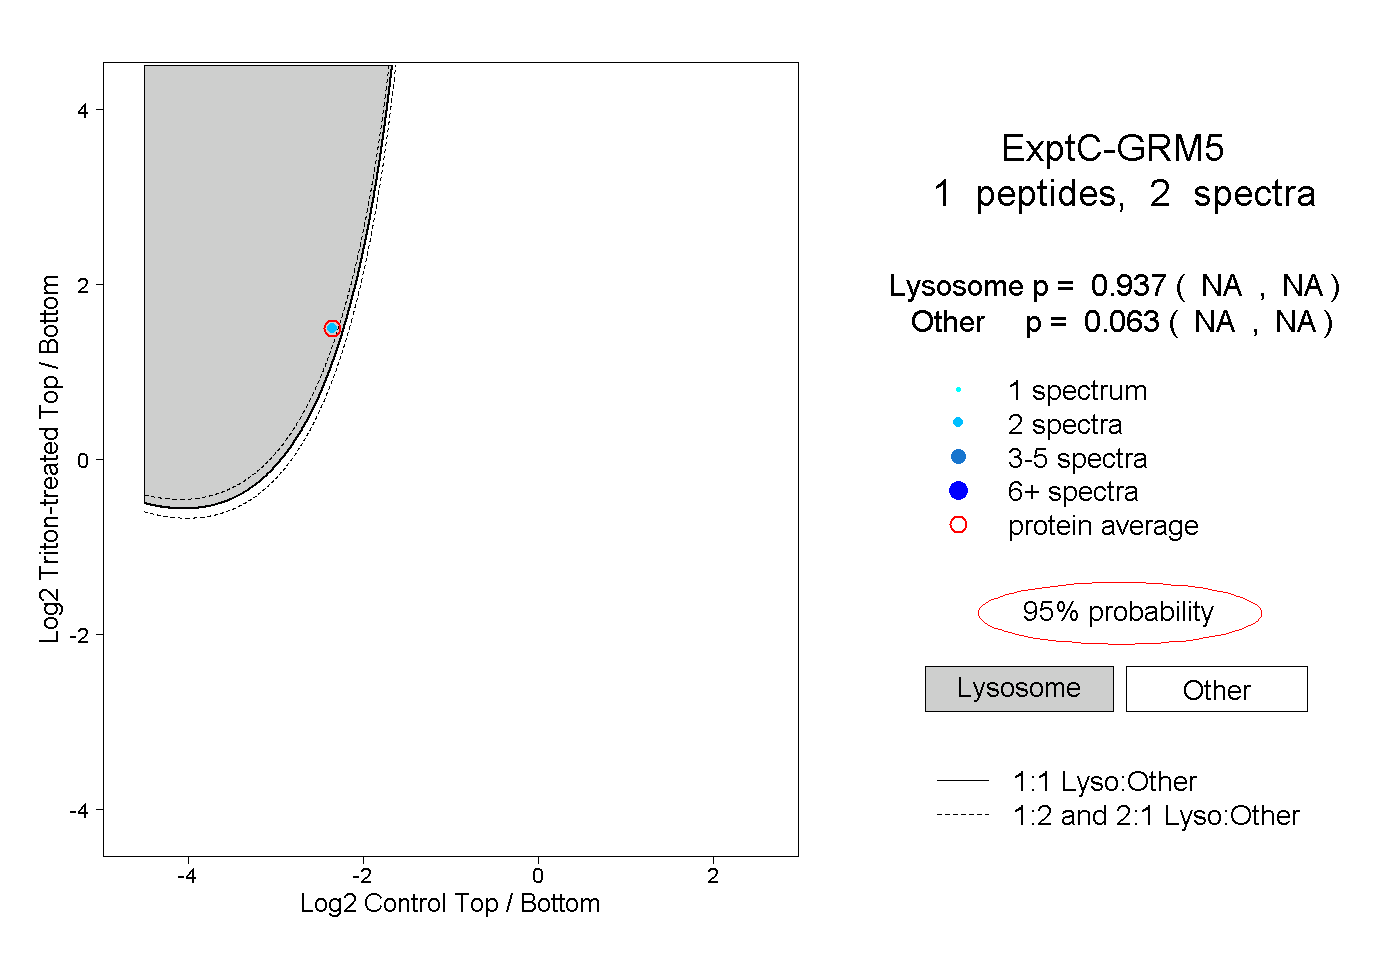
| Plot | Lyso | Other | |||||||||||
| Expt C |
1 peptide |
2 spectra |
|
0.937 NA | NA |
0.063 NA | NA |