10
10peptides
spectra
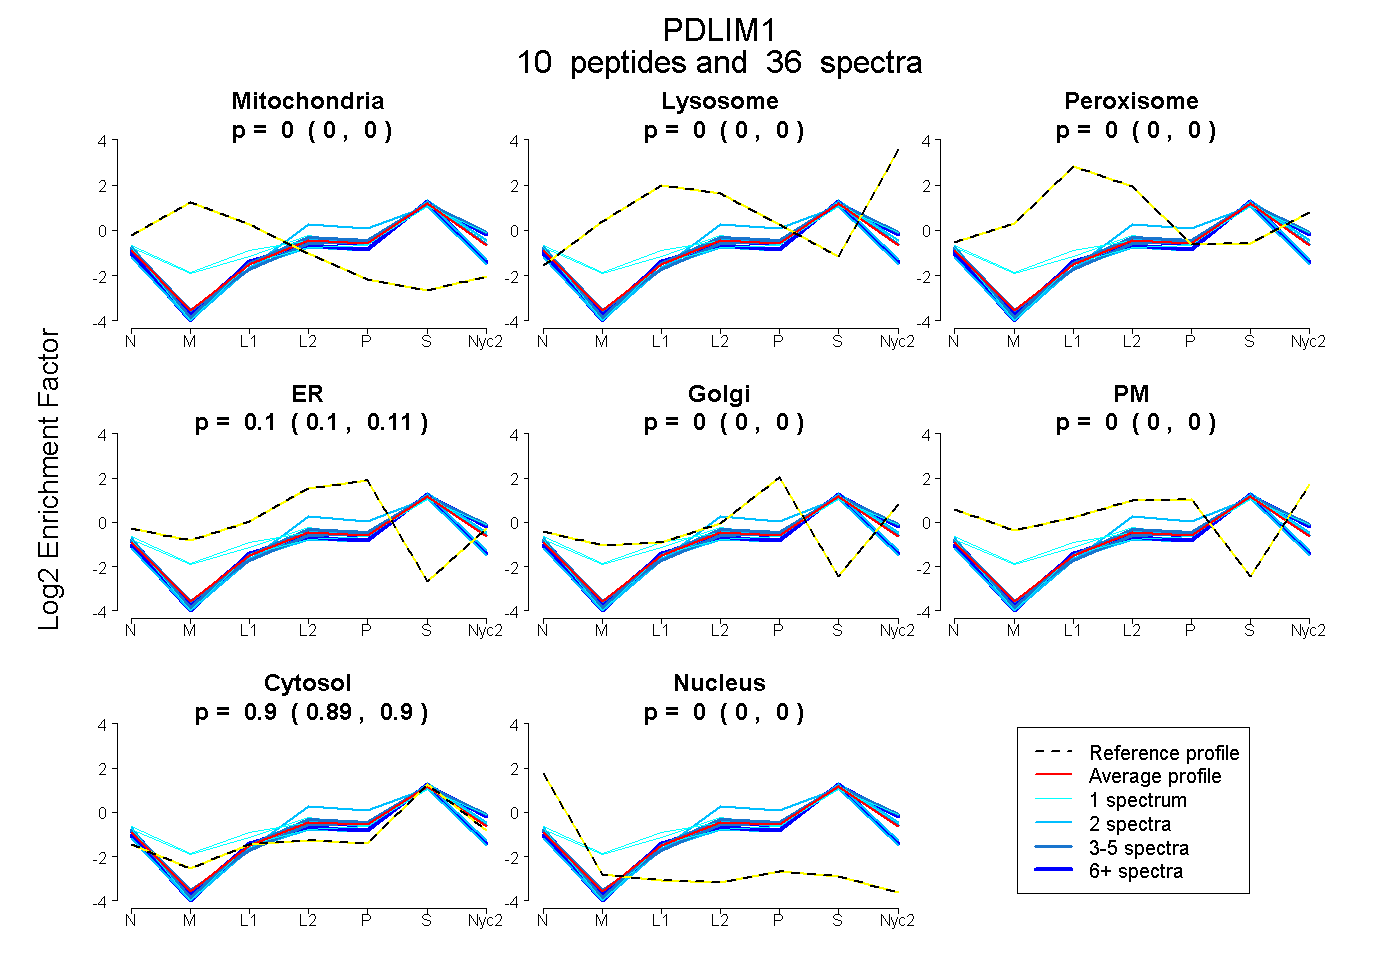
0.000 | 0.000
0.000 | 0.000
0.000 | 0.000
0.098 | 0.107
0.000 | 0.000
0.000 | 0.000
0.892 | 0.901
0.000 | 0.000
3peptides
spectra
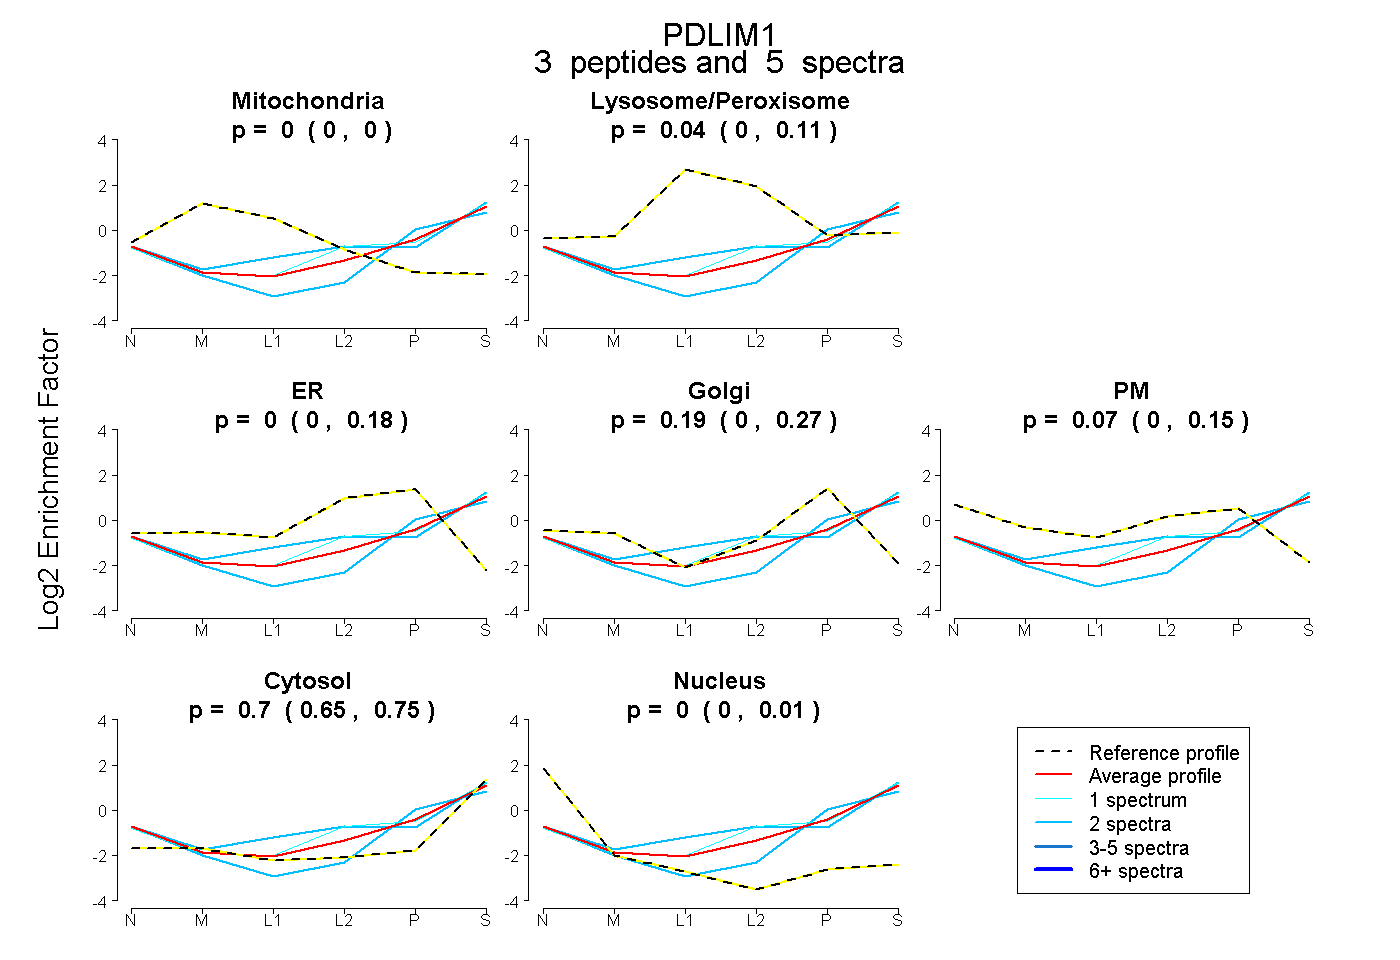
0.000 | 0.000
0.000 | 0.112
0.000 | 0.176
0.000 | 0.274
0.000 | 0.151
0.647 | 0.751
0.000 | 0.009