 10
10peptides
spectra
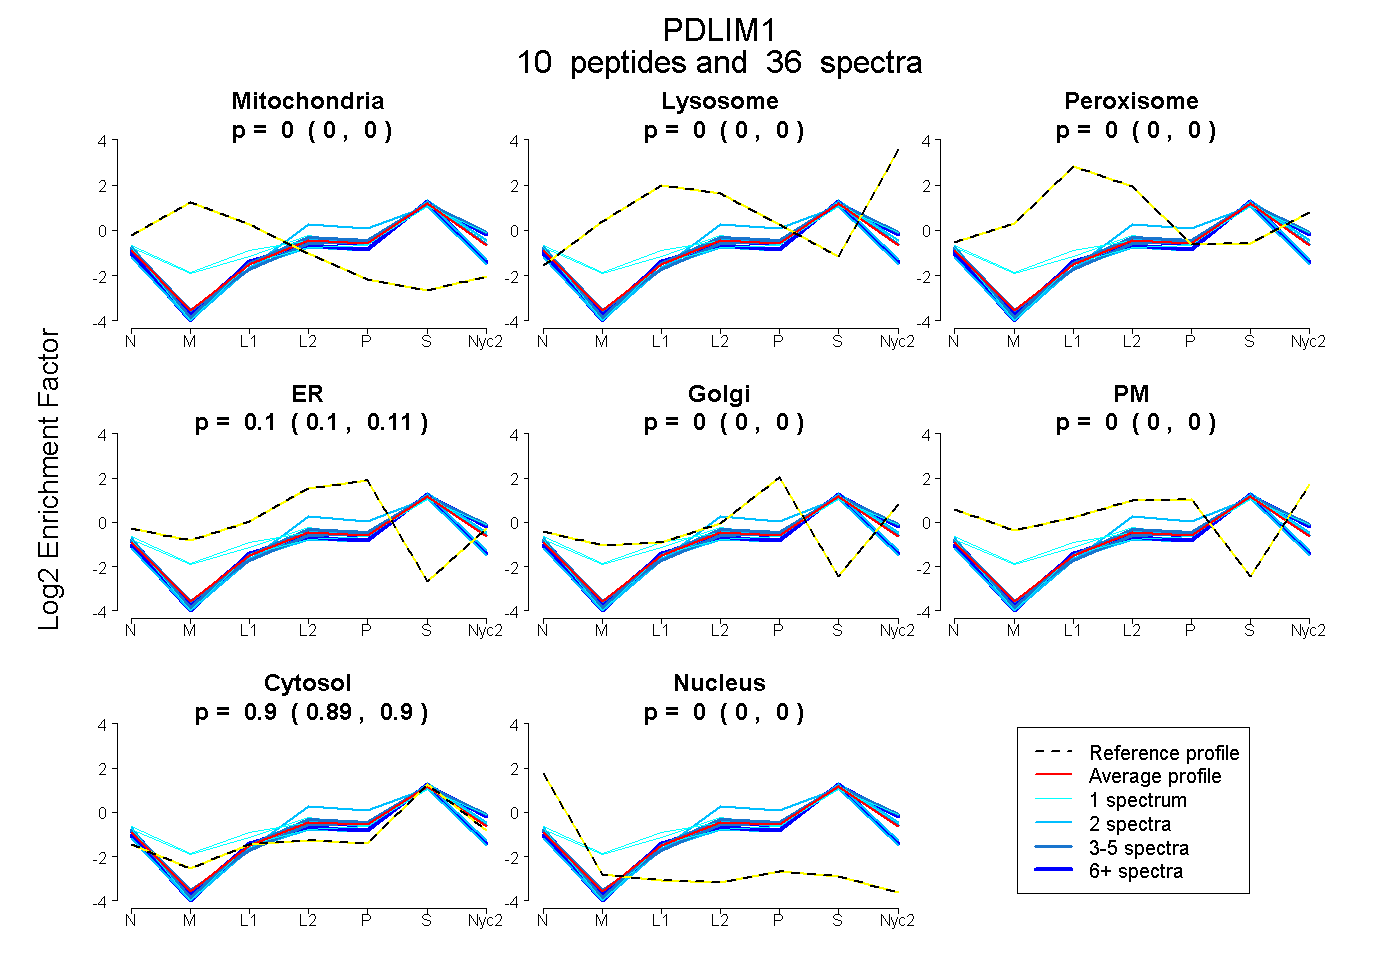
0.000 | 0.000
0.000 | 0.000
0.000 | 0.000
0.098 | 0.107
0.000 | 0.000
0.000 | 0.000
0.892 | 0.901
0.000 | 0.000
| Plot | Mito | Lyso | Perox | ER | Golgi | PM | Cytosol | Nucleus | |||||
| Expt A |
10 peptides |
36 spectra |
|
0.000 0.000 | 0.000 |
0.000 0.000 | 0.000 |
0.000 0.000 | 0.000 |
0.103 0.098 | 0.107 |
0.000 0.000 | 0.000 |
0.000 0.000 | 0.000 |
0.897 0.892 | 0.901 |
0.000 0.000 | 0.000 |
| 1 spectrum, IWSPLVTEEGK | 0.000 | 0.038 | 0.037 | 0.000 | 0.000 | 0.167 | 0.758 | 0.000 | ||
| 4 spectra, VAASVGNAQK | 0.000 | 0.000 | 0.000 | 0.022 | 0.082 | 0.033 | 0.863 | 0.000 | ||
| 2 spectra, ESEVYK | 0.000 | 0.000 | 0.000 | 0.000 | 0.024 | 0.000 | 0.976 | 0.000 | ||
| 2 spectra, HPECYVCTDCGINLK | 0.000 | 0.000 | 0.000 | 0.180 | 0.000 | 0.000 | 0.818 | 0.002 | ||
| 11 spectra, GCVDNMTLTVSR | 0.000 | 0.000 | 0.000 | 0.024 | 0.000 | 0.000 | 0.951 | 0.025 | ||
| 7 spectra, DFEQPLAISR | 0.000 | 0.000 | 0.000 | 0.007 | 0.068 | 0.038 | 0.887 | 0.000 | ||
| 1 spectrum, VTPGSK | 0.000 | 0.011 | 0.076 | 0.000 | 0.000 | 0.171 | 0.743 | 0.000 | ||
| 2 spectra, GHFFVGDQIYCEK | 0.000 | 0.000 | 0.000 | 0.052 | 0.000 | 0.000 | 0.948 | 0.000 | ||
| 1 spectrum, VTPPEGYDVVTVFPK | 0.000 | 0.000 | 0.000 | 0.000 | 0.070 | 0.000 | 0.930 | 0.000 | ||
| 5 spectra, QELNEPPK | 0.000 | 0.000 | 0.000 | 0.042 | 0.064 | 0.000 | 0.894 | 0.000 |
| Plot | Mito | Lyso or Perox | ER | Golgi | PM | Cytosol | Nucleus | ||||||
| Expt B |
3 peptides |
5 spectra |
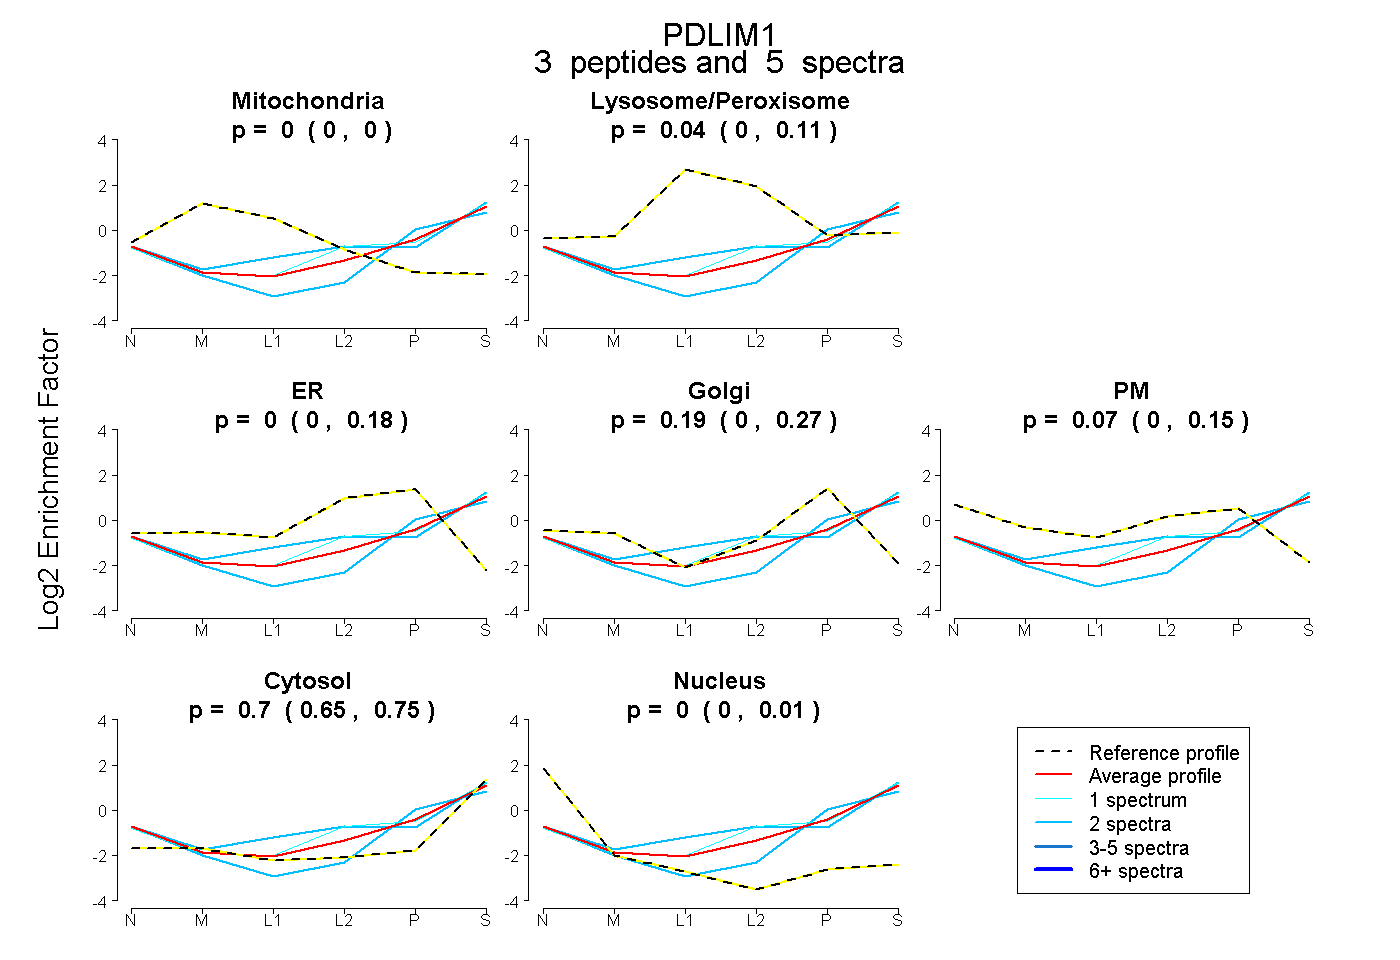 |
0.000 0.000 | 0.000 |
0.035 0.000 | 0.112 |
0.000 0.000 | 0.176 |
0.189 0.000 | 0.274 |
0.073 0.000 | 0.151 |
0.703 0.647 | 0.751 |
0.000 0.000 | 0.009 |
|||
| Plot | Lyso | Other | |||||||||||
| Expt C |
11 peptides |
39 spectra |
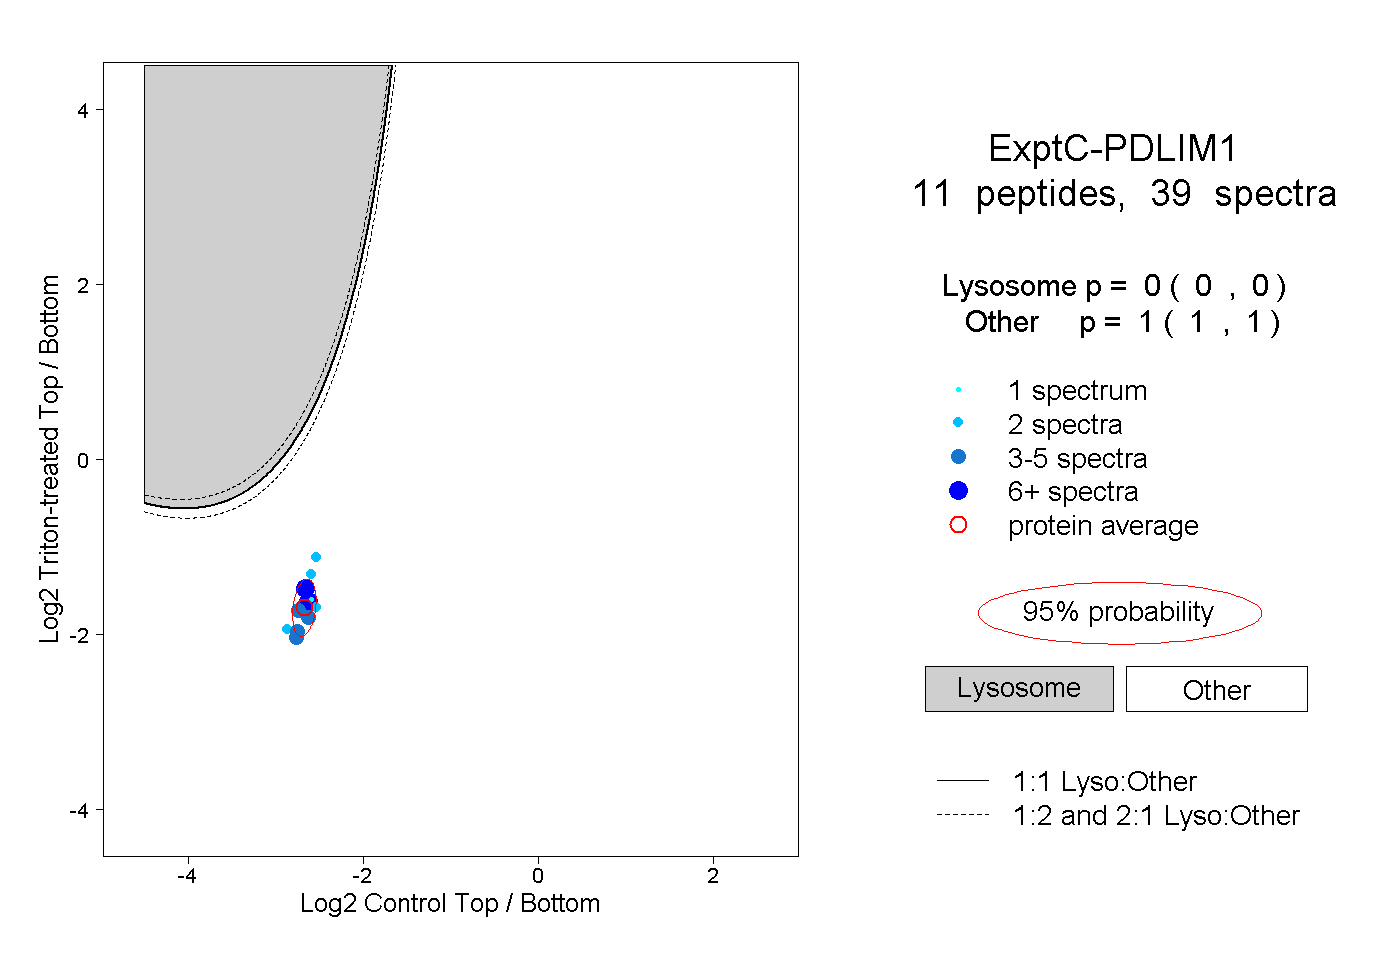 |
0.000 0.000 | 0.000 |
1.000 1.000 | 1.000 |
||||||||
| Plot | Lyso | Other | |||||||||||
| Expt D |
3 peptides |
3 spectra |
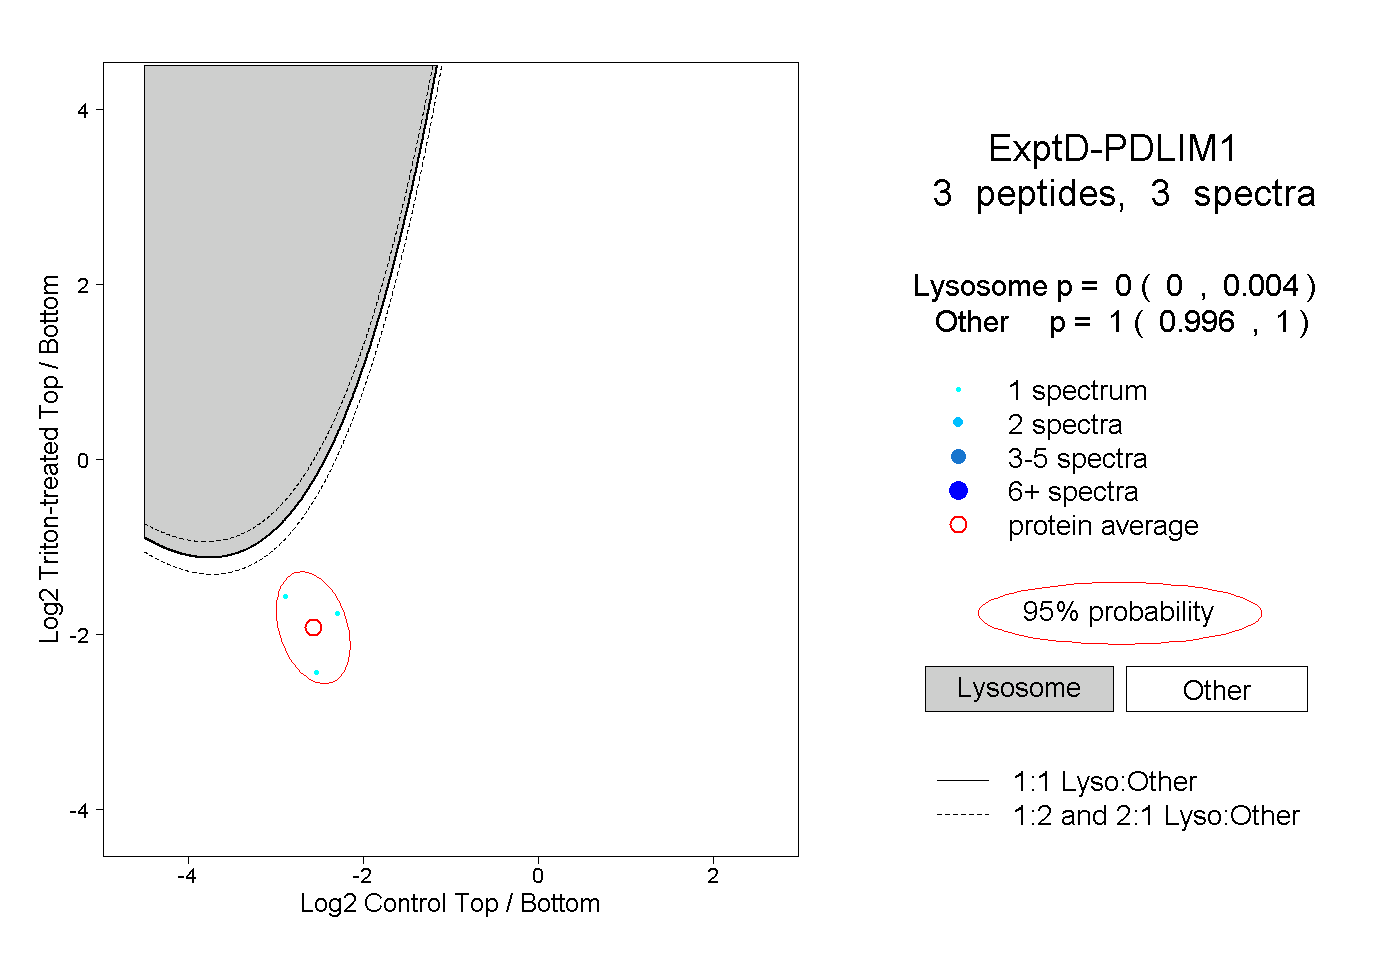 |
0.000 0.000 | 0.004 |
1.000 0.996 | 1.000 |