 6
6peptides
spectra
0.000 | 0.000
1.000 | 1.000
0.000 | 0.000
0.000 | 0.000
0.000 | 0.000
0.000 | 0.000
0.000 | 0.000
0.000 | 0.000
| Plot | Mito | Lyso | Perox | ER | Golgi | PM | Cytosol | Nucleus | |||||
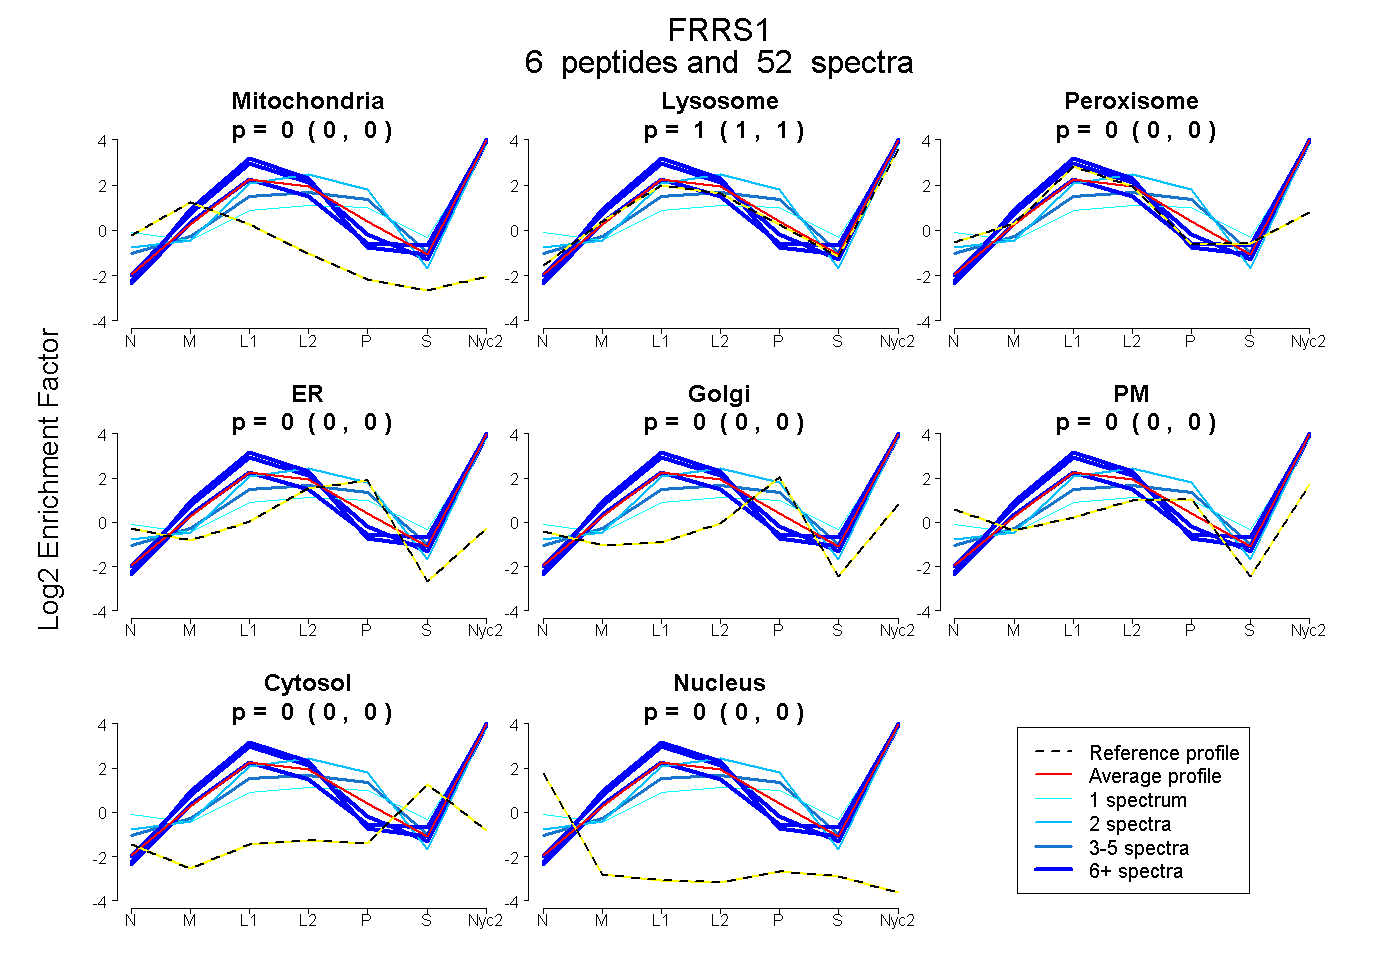
| Expt A |
6 peptides |
52 spectra |
|
0.000 0.000 | 0.000 |
1.000 1.000 | 1.000 |
0.000 0.000 | 0.000 |
0.000 0.000 | 0.000 |
0.000 0.000 | 0.000 |
0.000 0.000 | 0.000 |
0.000 0.000 | 0.000 |
0.000 0.000 | 0.000 |
| 12 spectra, ITVSQMK | 0.000 | 0.997 | 0.000 | 0.000 | 0.000 | 0.000 | 0.003 | 0.000 | ||
| 13 spectra, VTLSGPPFR | 0.000 | 0.989 | 0.011 | 0.000 | 0.000 | 0.000 | 0.000 | 0.000 | ||
| 19 spectra, GFLLEAR | 0.000 | 1.000 | 0.000 | 0.000 | 0.000 | 0.000 | 0.000 | 0.000 | ||
| 1 spectrum, HSQQPLITYEK | 0.000 | 0.647 | 0.000 | 0.000 | 0.000 | 0.287 | 0.066 | 0.000 | ||
| 5 spectra, GTLEDMAWR | 0.000 | 0.872 | 0.000 | 0.000 | 0.126 | 0.002 | 0.000 | 0.000 | ||
| 2 spectra, LADGVIQCSFR | 0.000 | 0.812 | 0.000 | 0.041 | 0.000 | 0.147 | 0.000 | 0.000 |
| Plot | Mito | Lyso or Perox | ER | Golgi | PM | Cytosol | Nucleus | ||||||
| Expt B |
3 peptides |
18 spectra |
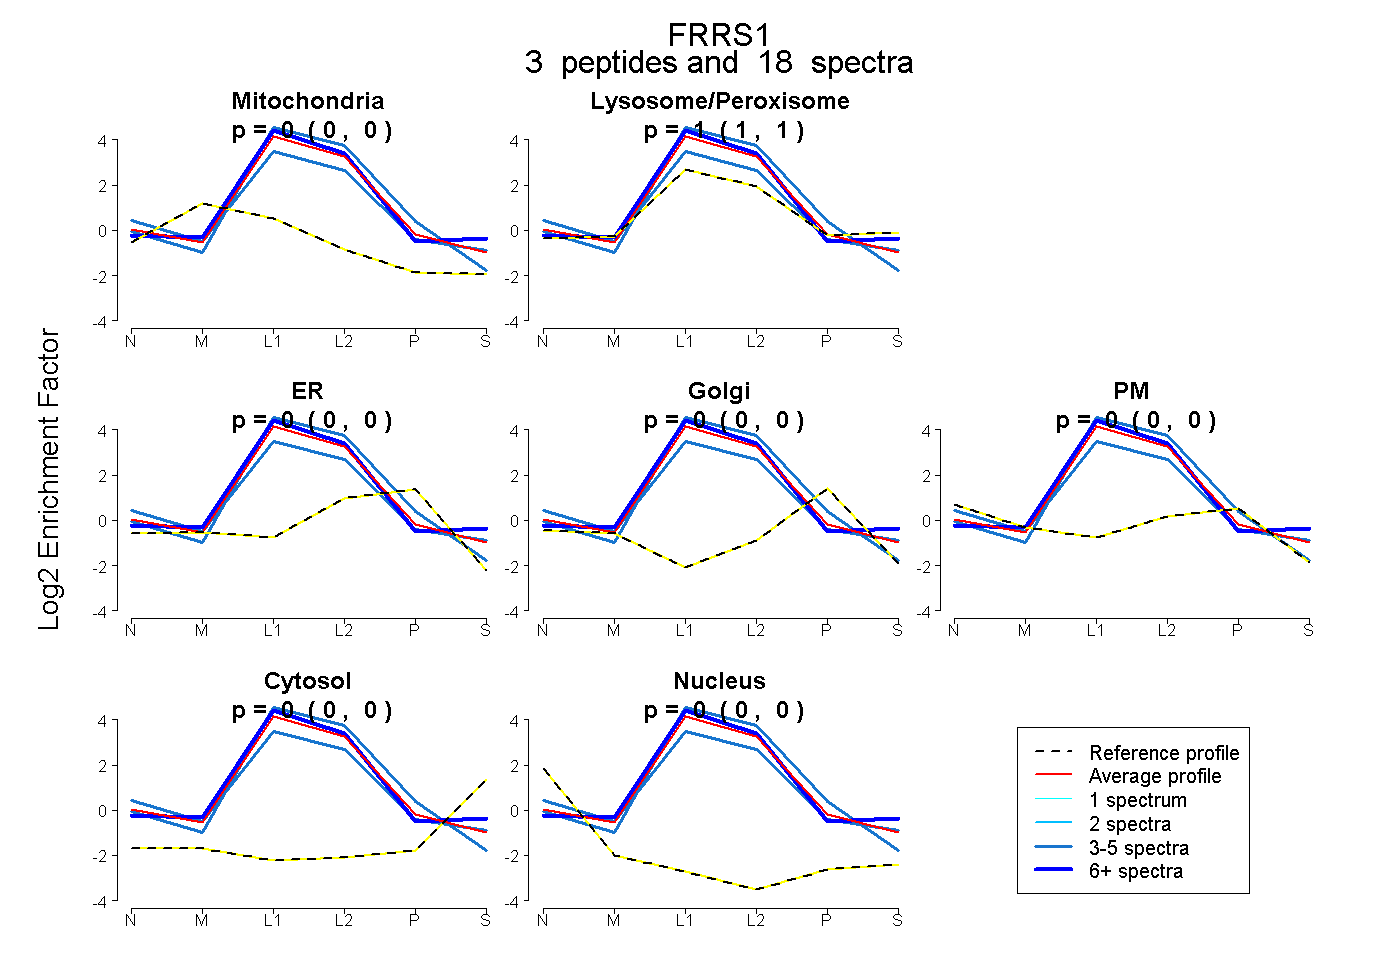 |
0.000 0.000 | 0.000 |
1.000 1.000 | 1.000 |
0.000 0.000 | 0.000 |
0.000 0.000 | 0.000 |
0.000 0.000 | 0.000 |
0.000 0.000 | 0.000 |
0.000 0.000 | 0.000 |
|||
| Plot | Lyso | Other | |||||||||||
| Expt C |
9 peptides |
363 spectra |
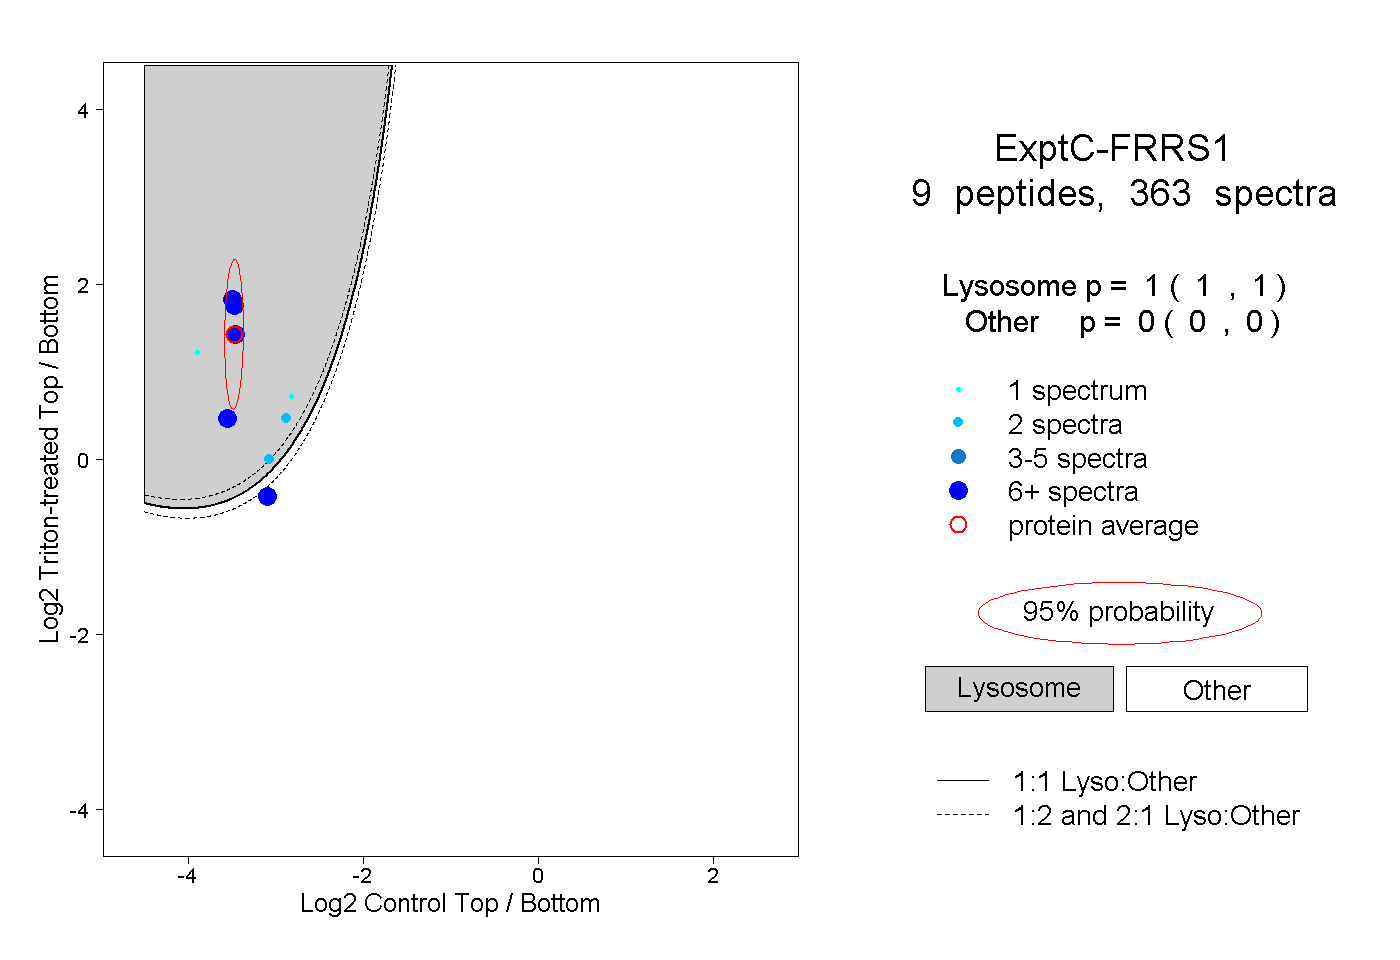 |
1.000 1.000 | 1.000 |
0.000 0.000 | 0.000 |
||||||||
| Plot | Lyso | Other | |||||||||||
| Expt D |
5 peptides |
10 spectra |
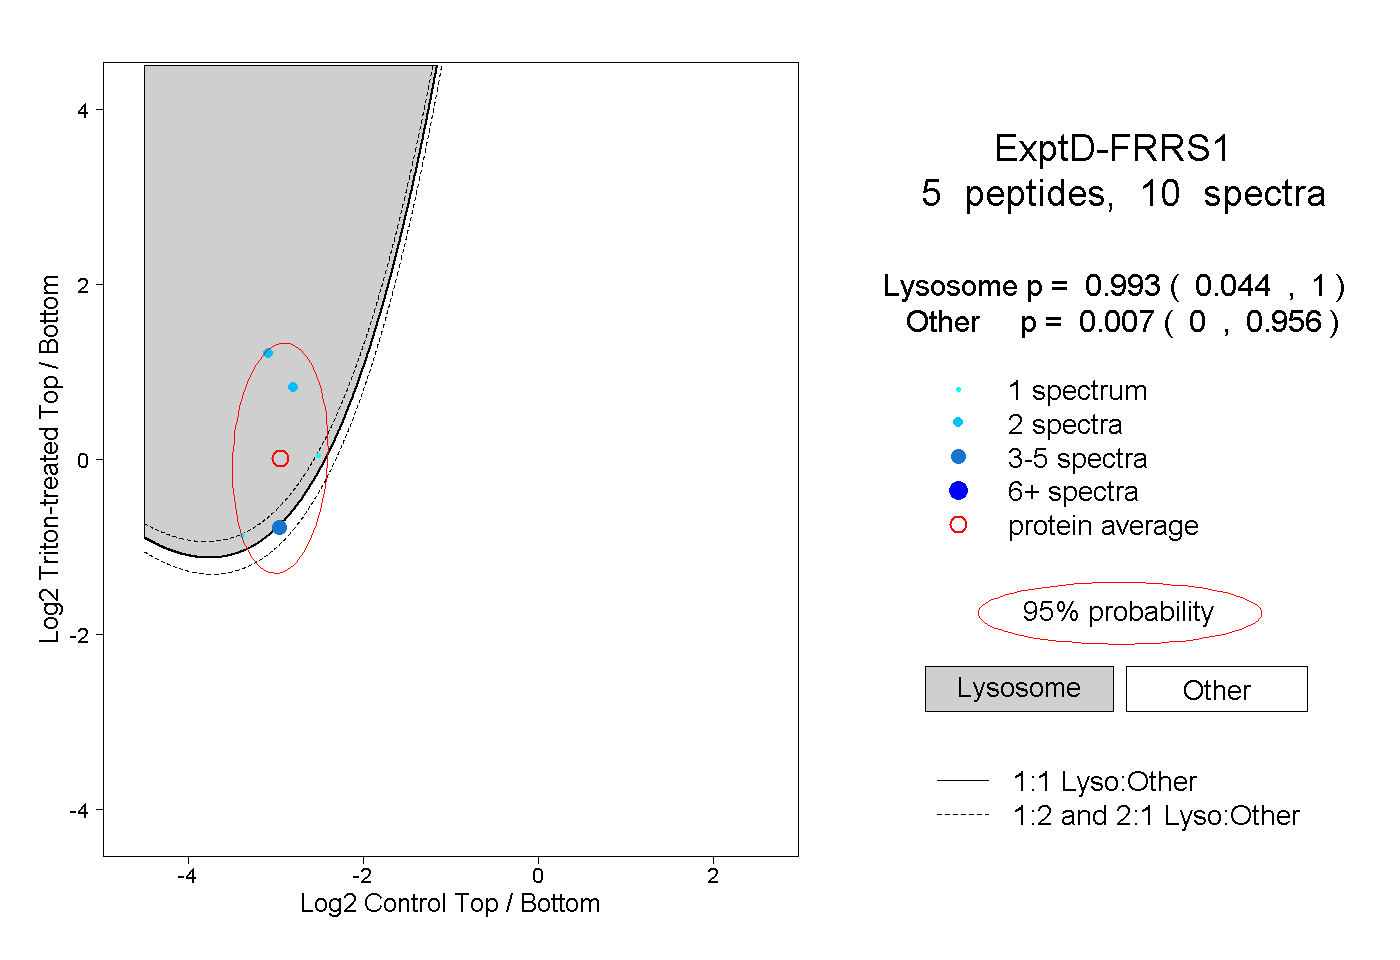 |
0.993 0.044 | 1.000 |
0.007 0.000 | 0.956 |