 2
2peptides
spectra
0.000 | 0.000
0.186 | 0.253
0.000 | 0.046
0.000 | 0.000
0.000 | 0.000
0.181 | 0.240
0.526 | 0.570
0.000 | 0.000
1peptide
spectrum
NA | NA
NA | NA
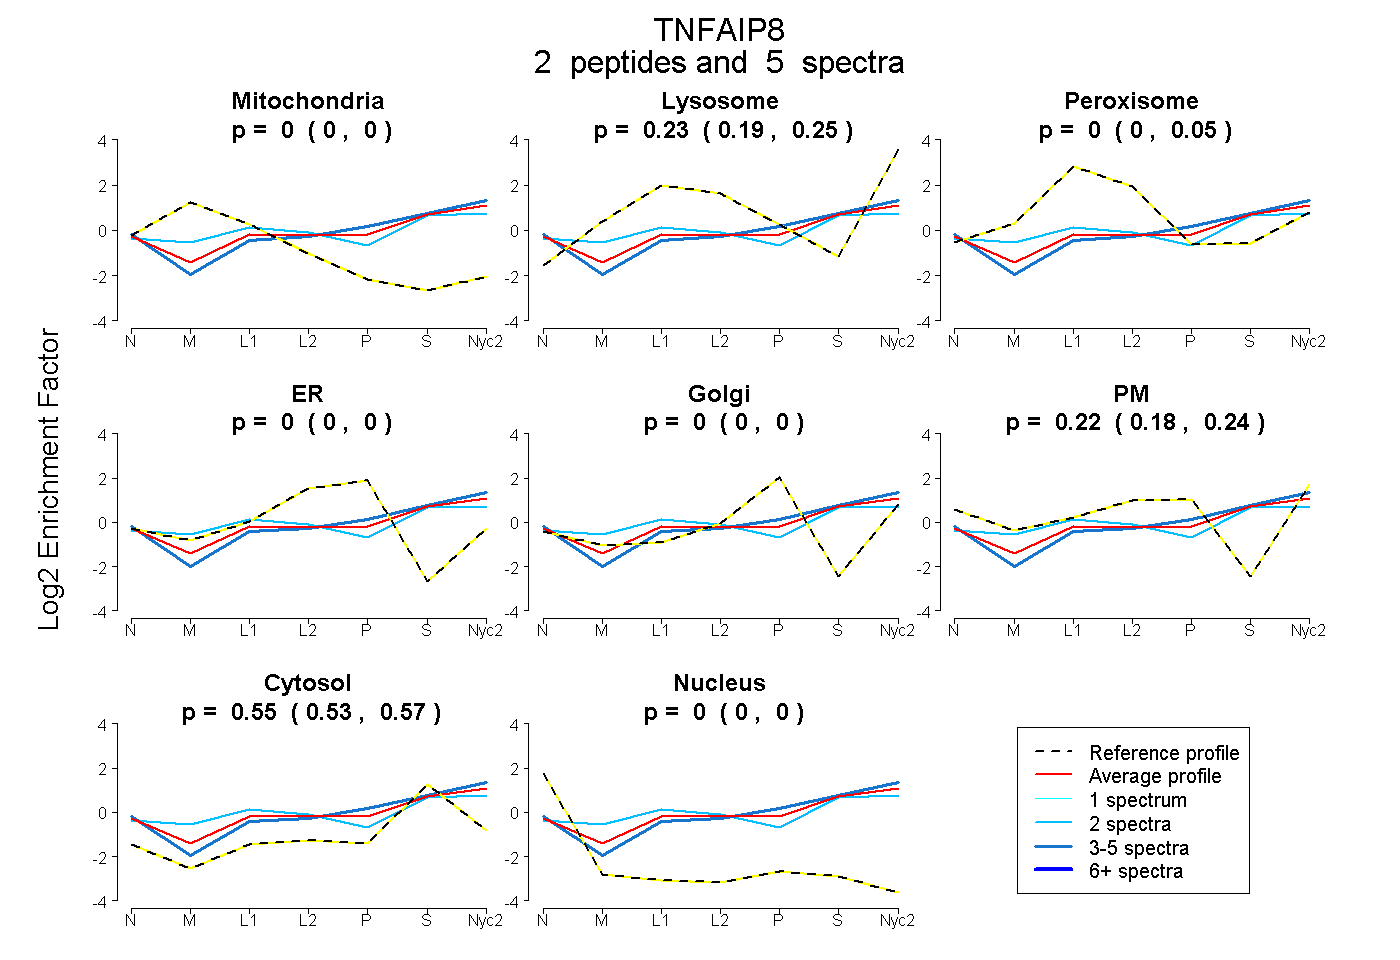
| Plot | Mito | Lyso | Perox | ER | Golgi | PM | Cytosol | Nucleus | |||||
| Expt A |
2 peptides |
5 spectra |
|
0.000 0.000 | 0.000 |
0.231 0.186 | 0.253 |
0.003 0.000 | 0.046 |
0.000 0.000 | 0.000 |
0.000 0.000 | 0.000 |
0.215 0.181 | 0.240 |
0.551 0.526 | 0.570 |
0.000 0.000 | 0.000 |
||
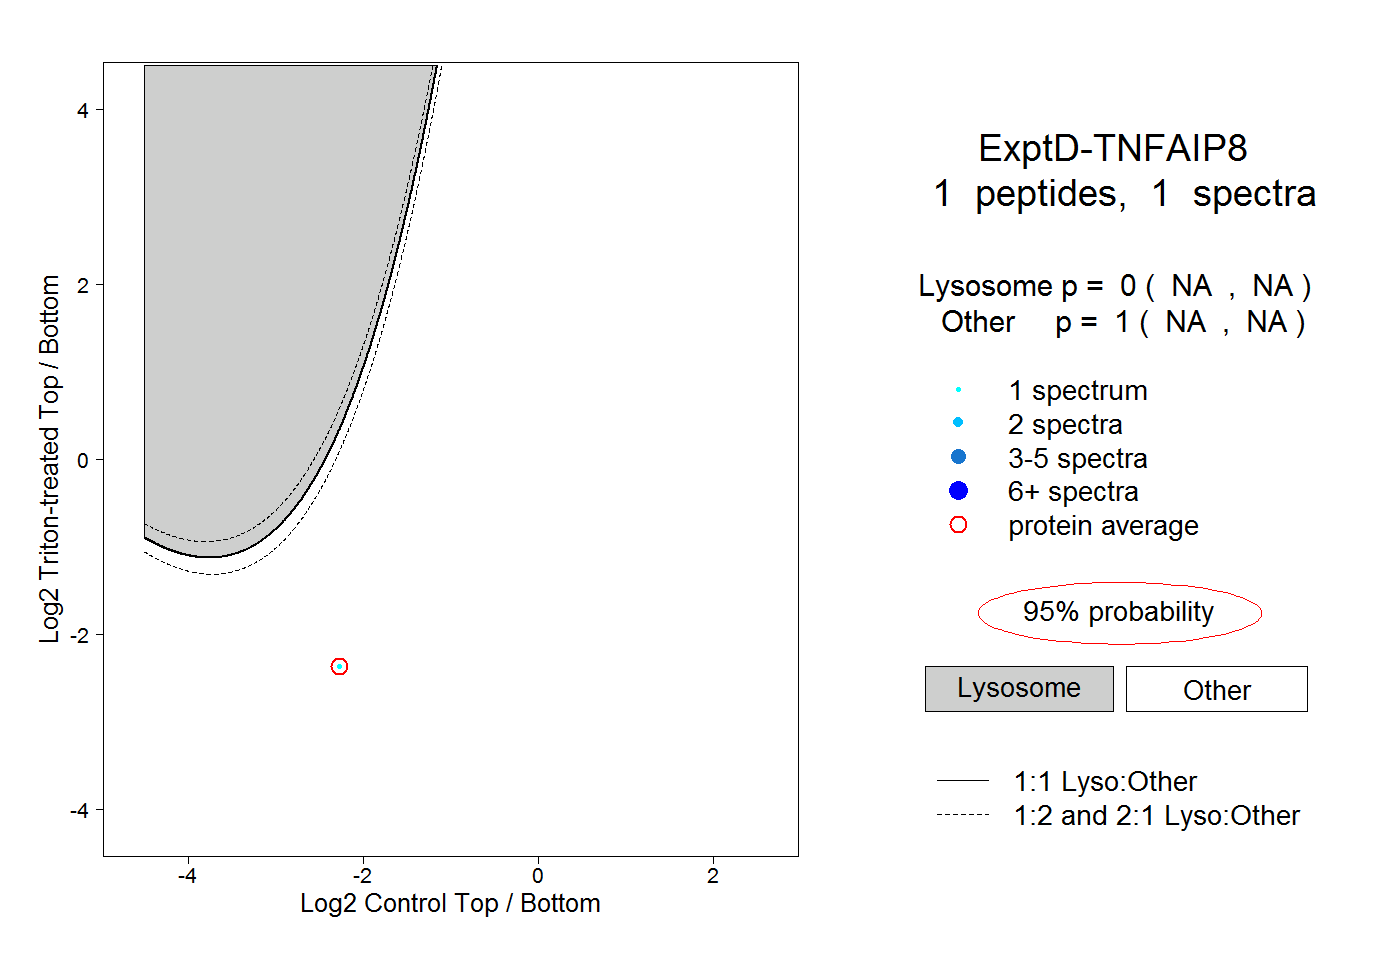
| Plot | Lyso | Other | |||||||||||
| Expt D |
1 peptide |
1 spectrum |
|
0.000 NA | NA |
1.000 NA | NA |