 1
1peptide
spectrum
NA | NA
NA | NA
NA | NA
NA | NA
NA | NA
NA | NA
NA | NA
NA | NA
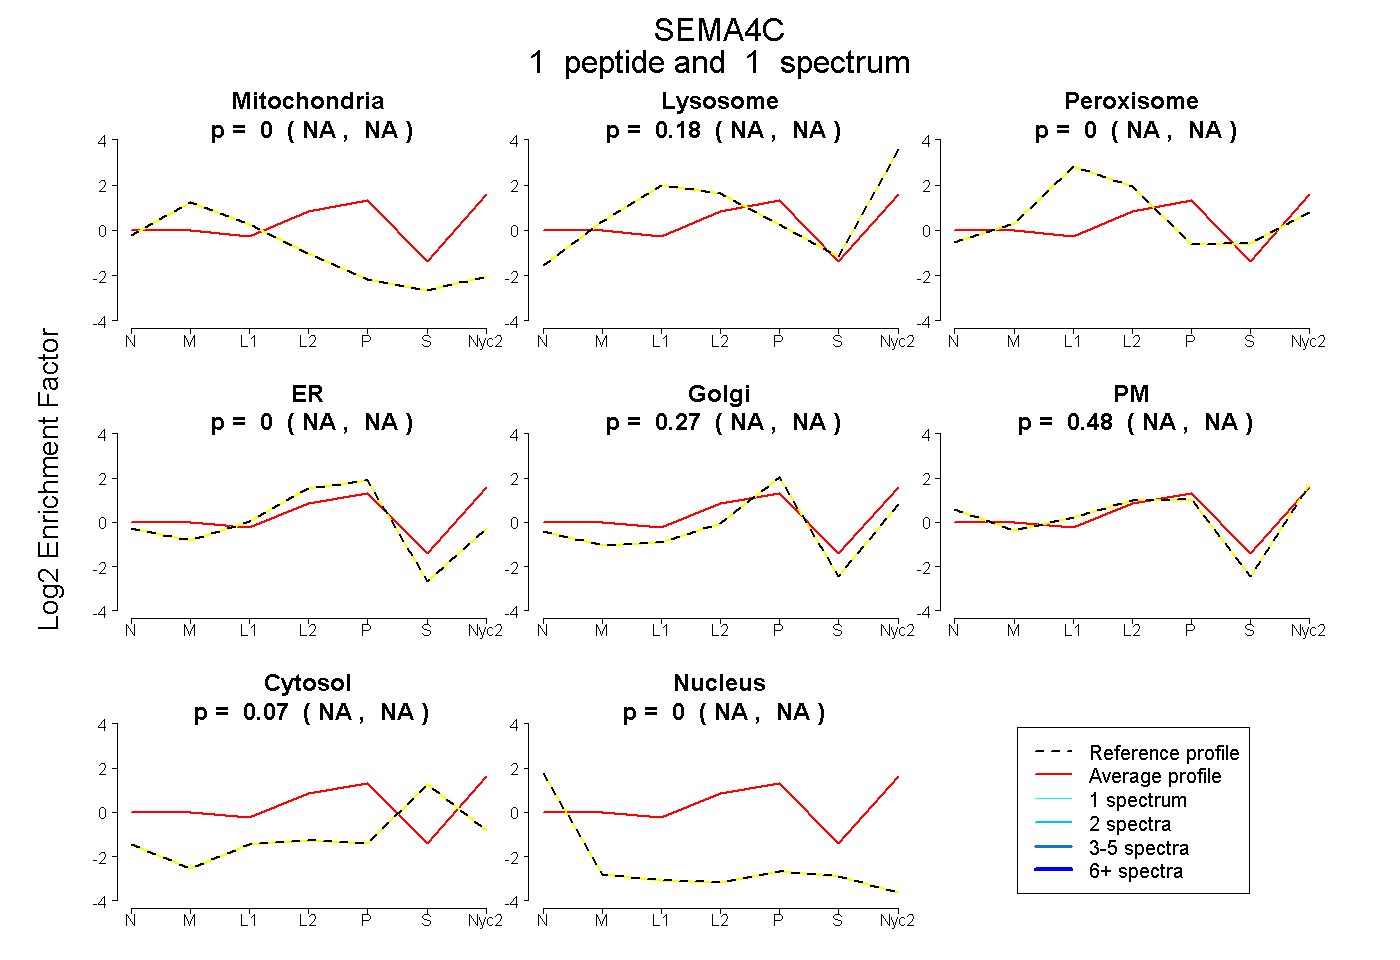
| Plot | Mito | Lyso | Perox | ER | Golgi | PM | Cytosol | Nucleus | |||||
| Expt A |
1 peptide |
1 spectrum |
|
0.000 NA | NA |
0.178 NA | NA |
0.000 NA | NA |
0.000 NA | NA |
0.268 NA | NA |
0.484 NA | NA |
0.070 NA | NA |
0.000 NA | NA |
| 1 spectrum, IVPGHAR | 0.000 | 0.178 | 0.000 | 0.000 | 0.268 | 0.484 | 0.070 | 0.000 |