 3
3peptides
spectra
0.000 | 0.000
0.000 | 0.000
0.000 | 0.123
0.045 | 0.526
0.000 | 0.000
0.000 | 0.553
0.271 | 0.372
0.000 | 0.118
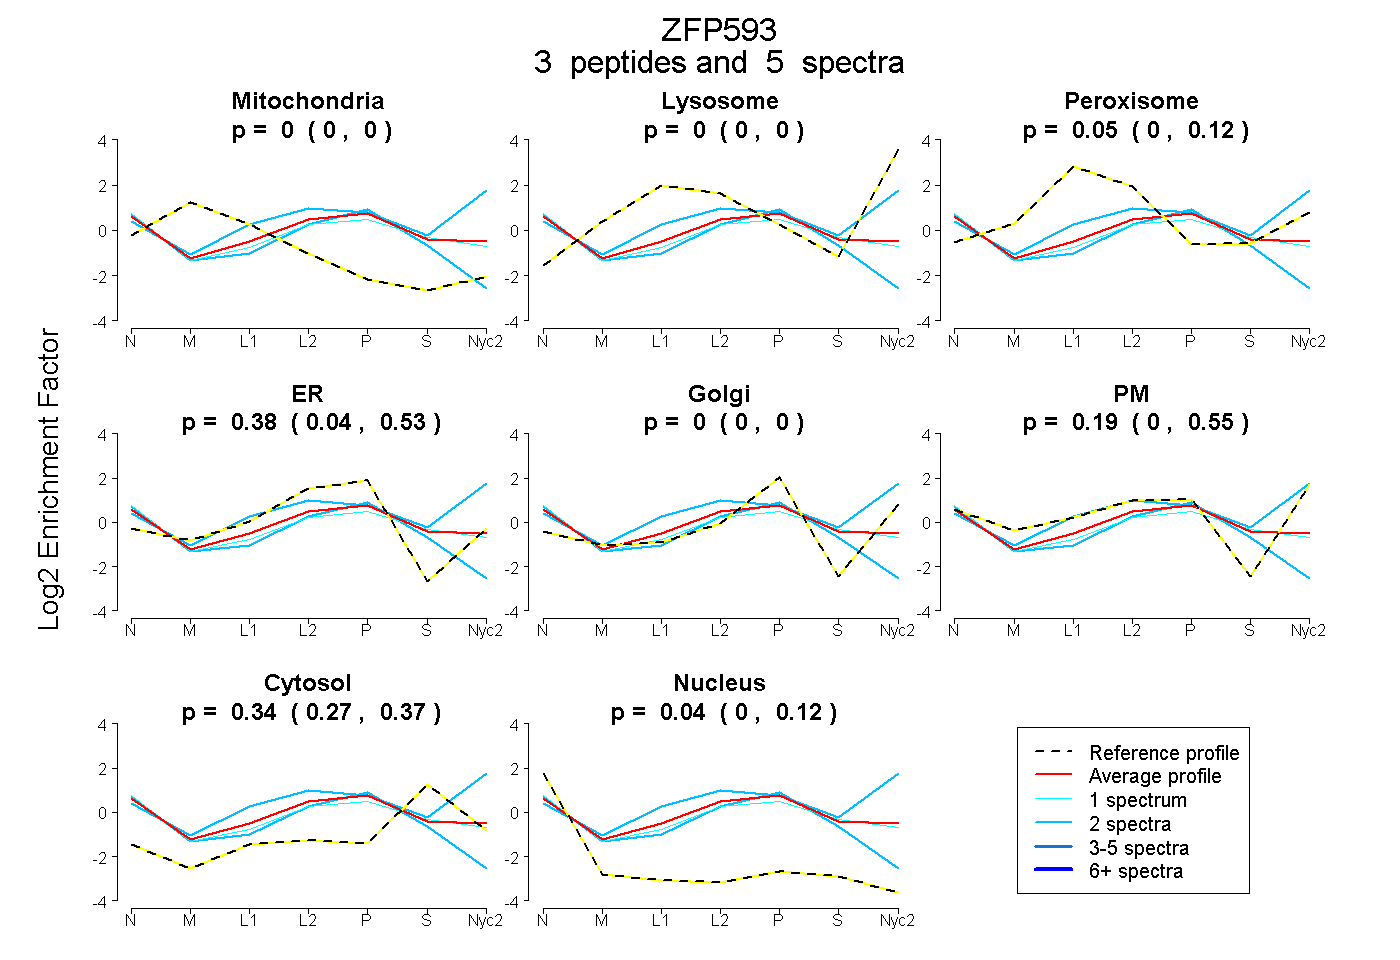
| Plot | Mito | Lyso | Perox | ER | Golgi | PM | Cytosol | Nucleus | |||||
| Expt A |
3 peptides |
5 spectra |
|
0.000 0.000 | 0.000 |
0.000 0.000 | 0.000 |
0.046 0.000 | 0.123 |
0.378 0.045 | 0.526 |
0.000 0.000 | 0.000 |
0.195 0.000 | 0.553 |
0.337 0.271 | 0.372 |
0.044 0.000 | 0.118 |
| 2 spectra, DAEPDPDLPGGGLHR | 0.000 | 0.000 | 0.000 | 0.544 | 0.000 | 0.000 | 0.233 | 0.222 | ||
| 2 spectra, QLSVEPYSQEEAER | 0.000 | 0.184 | 0.044 | 0.000 | 0.000 | 0.532 | 0.240 | 0.000 | ||
| 1 spectrum, RPDLDEIHR | 0.000 | 0.000 | 0.031 | 0.317 | 0.000 | 0.202 | 0.355 | 0.095 |