 1
1peptide
spectra
0.000 | 0.000
0.000 | 0.000
0.959 | 0.971
0.000 | 0.000
0.000 | 0.000
0.000 | 0.000
0.028 | 0.039
3peptides
spectra
0.000 | 0.000
1.000 | 1.000
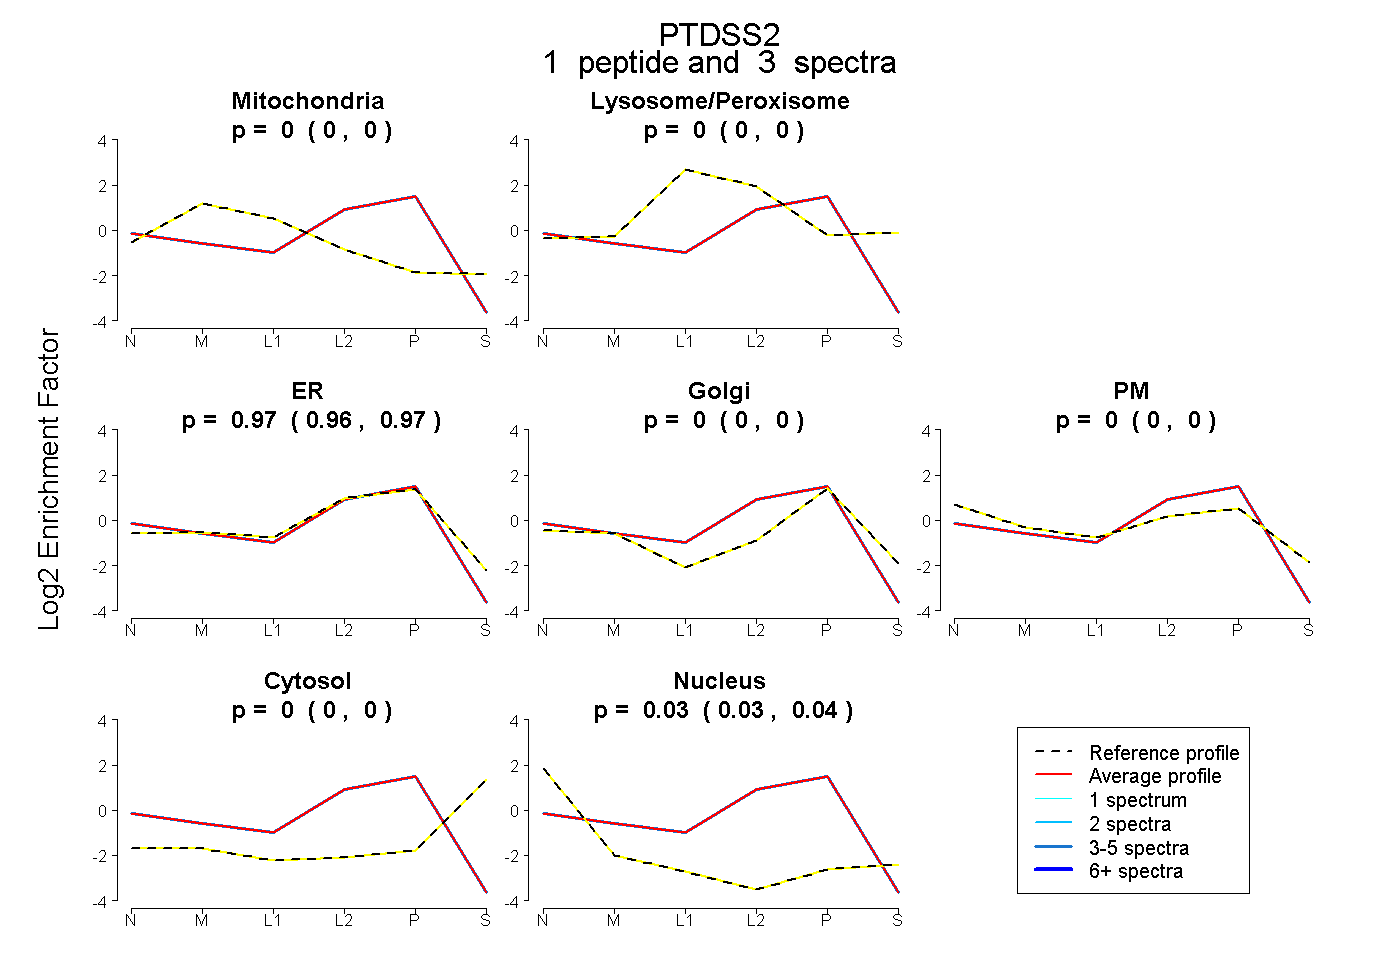
| Plot | Mito | Lyso or Perox | ER | Golgi | PM | Cytosol | Nucleus | ||||||
| Expt B |
1 peptide |
3 spectra |
|
0.000 0.000 | 0.000 |
0.000 0.000 | 0.000 |
0.966 0.959 | 0.971 |
0.000 0.000 | 0.000 |
0.000 0.000 | 0.000 |
0.000 0.000 | 0.000 |
0.034 0.028 | 0.039 |
|||
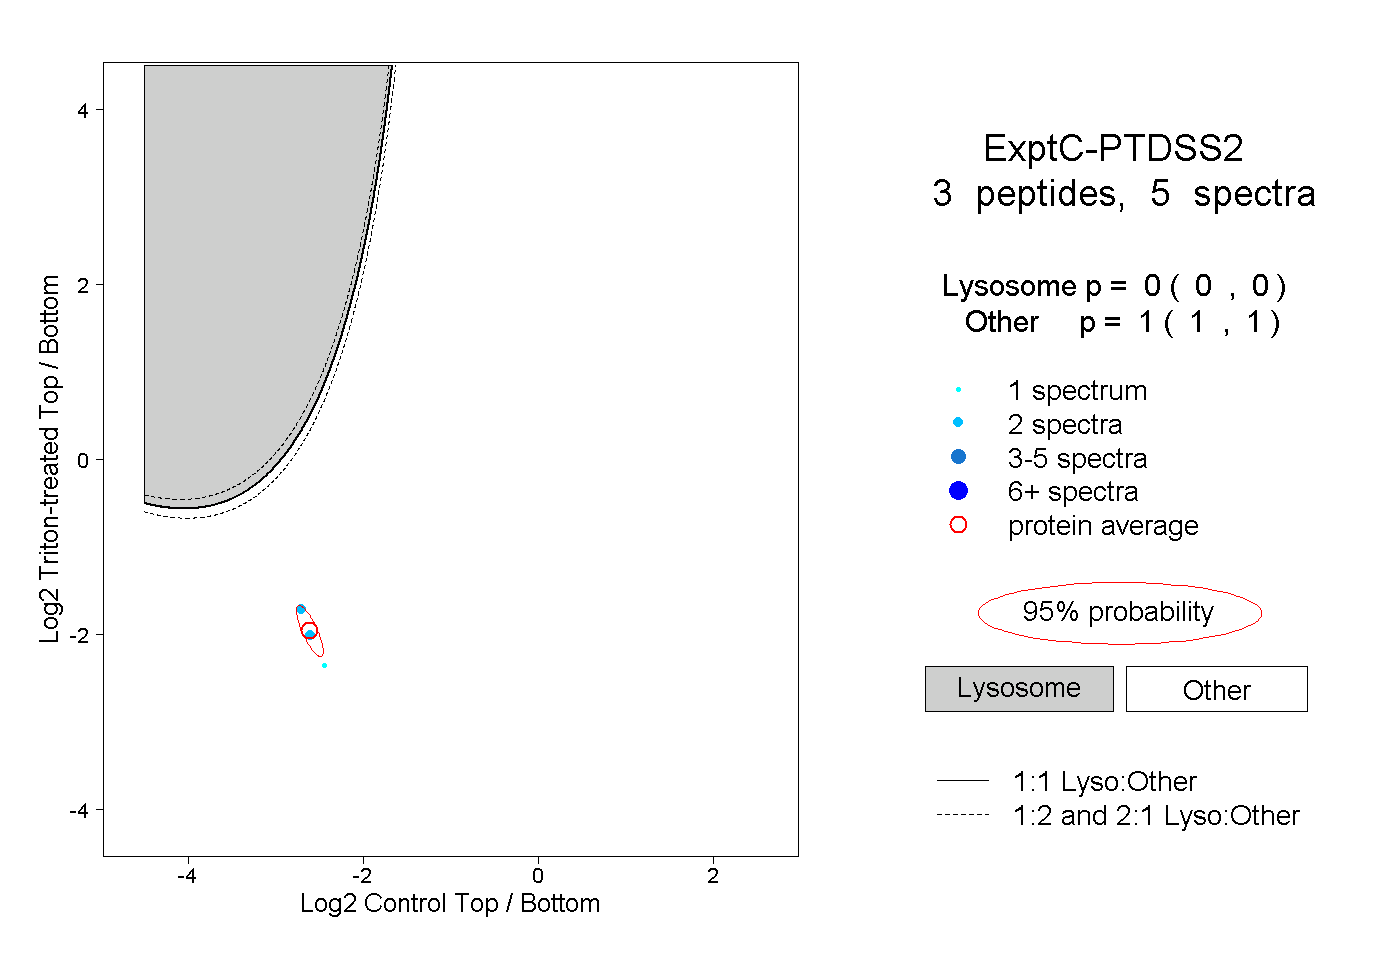
| Plot | Lyso | Other | |||||||||||
| Expt C |
3 peptides |
5 spectra |
|
0.000 0.000 | 0.000 |
1.000 1.000 | 1.000 |