 13
13peptides
spectra
0.706 | 0.714
0.013 | 0.025
0.000 | 0.000
0.000 | 0.000
0.010 | 0.026
0.239 | 0.261
0.000 | 0.000
0.000 | 0.000
| Plot | Mito | Lyso | Perox | ER | Golgi | PM | Cytosol | Nucleus | |||||
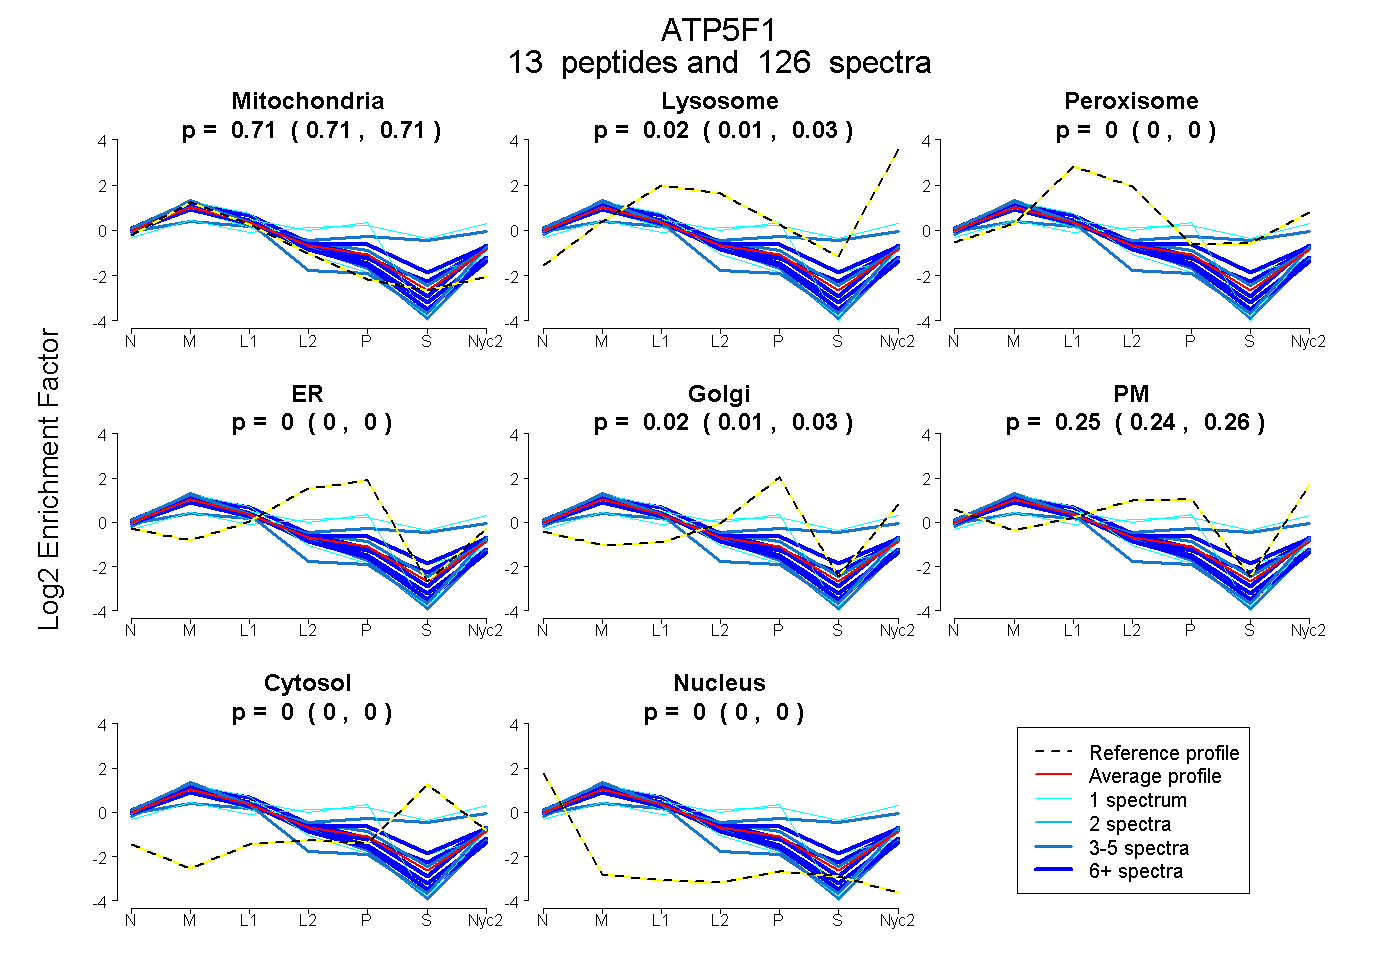
| Expt A |
13 peptides |
126 spectra |
|
0.711 0.706 | 0.714 |
0.020 0.013 | 0.025 |
0.000 0.000 | 0.000 |
0.000 0.000 | 0.000 |
0.018 0.010 | 0.026 |
0.251 0.239 | 0.261 |
0.000 0.000 | 0.000 |
0.000 0.000 | 0.000 |
| 3 spectra, YGASIGEFIDK | 0.853 | 0.000 | 0.000 | 0.000 | 0.000 | 0.140 | 0.000 | 0.007 | ||
| 1 spectrum, TGVTGPYVLGTGLSLYFLSK | 0.831 | 0.011 | 0.000 | 0.000 | 0.000 | 0.158 | 0.000 | 0.000 | ||
| 43 spectra, QIQDAINR | 0.845 | 0.000 | 0.000 | 0.000 | 0.000 | 0.155 | 0.000 | 0.000 | ||
| 14 spectra, AQQALVQK | 0.724 | 0.074 | 0.000 | 0.000 | 0.000 | 0.187 | 0.014 | 0.000 | ||
| 18 spectra, HYLFDVQR | 0.590 | 0.029 | 0.097 | 0.000 | 0.197 | 0.067 | 0.021 | 0.000 | ||
| 5 spectra, NNIALALEVTYR | 0.852 | 0.000 | 0.000 | 0.000 | 0.000 | 0.148 | 0.000 | 0.000 | ||
| 9 spectra, EGEHMINWVEK | 0.701 | 0.067 | 0.000 | 0.000 | 0.000 | 0.232 | 0.000 | 0.000 | ||
| 1 spectrum, LDYHISVQDMMR | 0.162 | 0.095 | 0.204 | 0.000 | 0.216 | 0.102 | 0.222 | 0.000 | ||
| 5 spectra, AQAQPIM | 0.271 | 0.039 | 0.171 | 0.000 | 0.054 | 0.206 | 0.259 | 0.000 | ||
| 1 spectrum, LGLIPEEFFQFLYPK | 0.474 | 0.000 | 0.000 | 0.360 | 0.000 | 0.166 | 0.000 | 0.000 | ||
| 1 spectrum, CIGDLK | 0.630 | 0.000 | 0.078 | 0.024 | 0.197 | 0.057 | 0.012 | 0.000 | ||
| 20 spectra, IAQLEEIK | 0.806 | 0.000 | 0.000 | 0.000 | 0.000 | 0.194 | 0.000 | 0.000 | ||
| 5 spectra, HVIQSISAQQEK | 0.679 | 0.060 | 0.000 | 0.006 | 0.102 | 0.153 | 0.000 | 0.000 |
| Plot | Mito | Lyso or Perox | ER | Golgi | PM | Cytosol | Nucleus | ||||||
| Expt B |
7 peptides |
83 spectra |
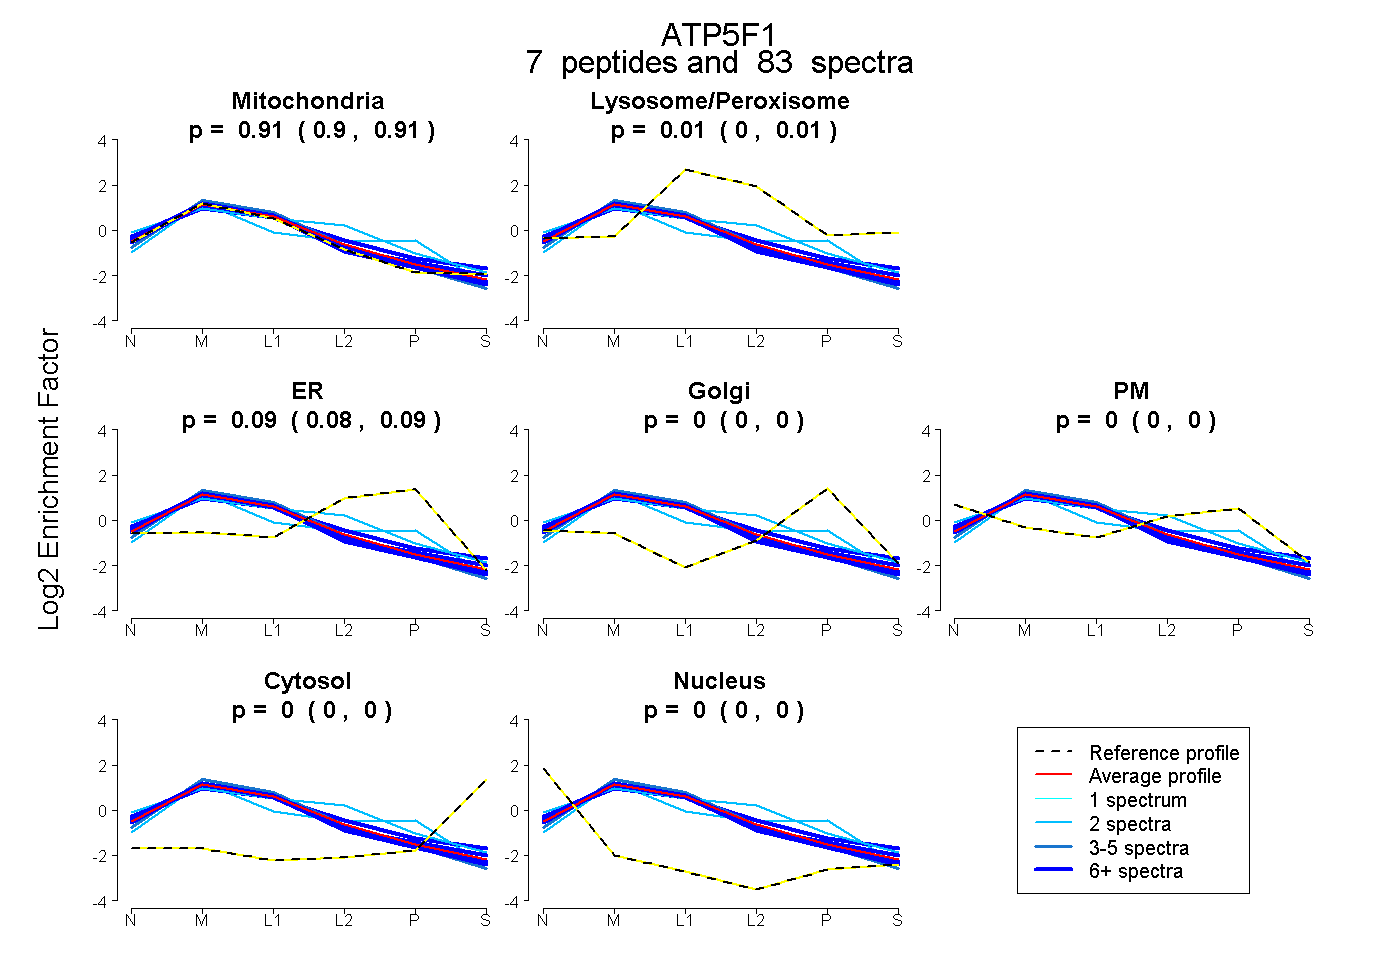 |
0.905 0.900 | 0.910 |
0.009 0.005 | 0.014 |
0.085 0.081 | 0.089 |
0.000 0.000 | 0.000 |
0.000 0.000 | 0.000 |
0.000 0.000 | 0.000 |
0.000 0.000 | 0.000 |
|||
| Plot | Lyso | Other | |||||||||||
| Expt C |
12 peptides |
346 spectra |
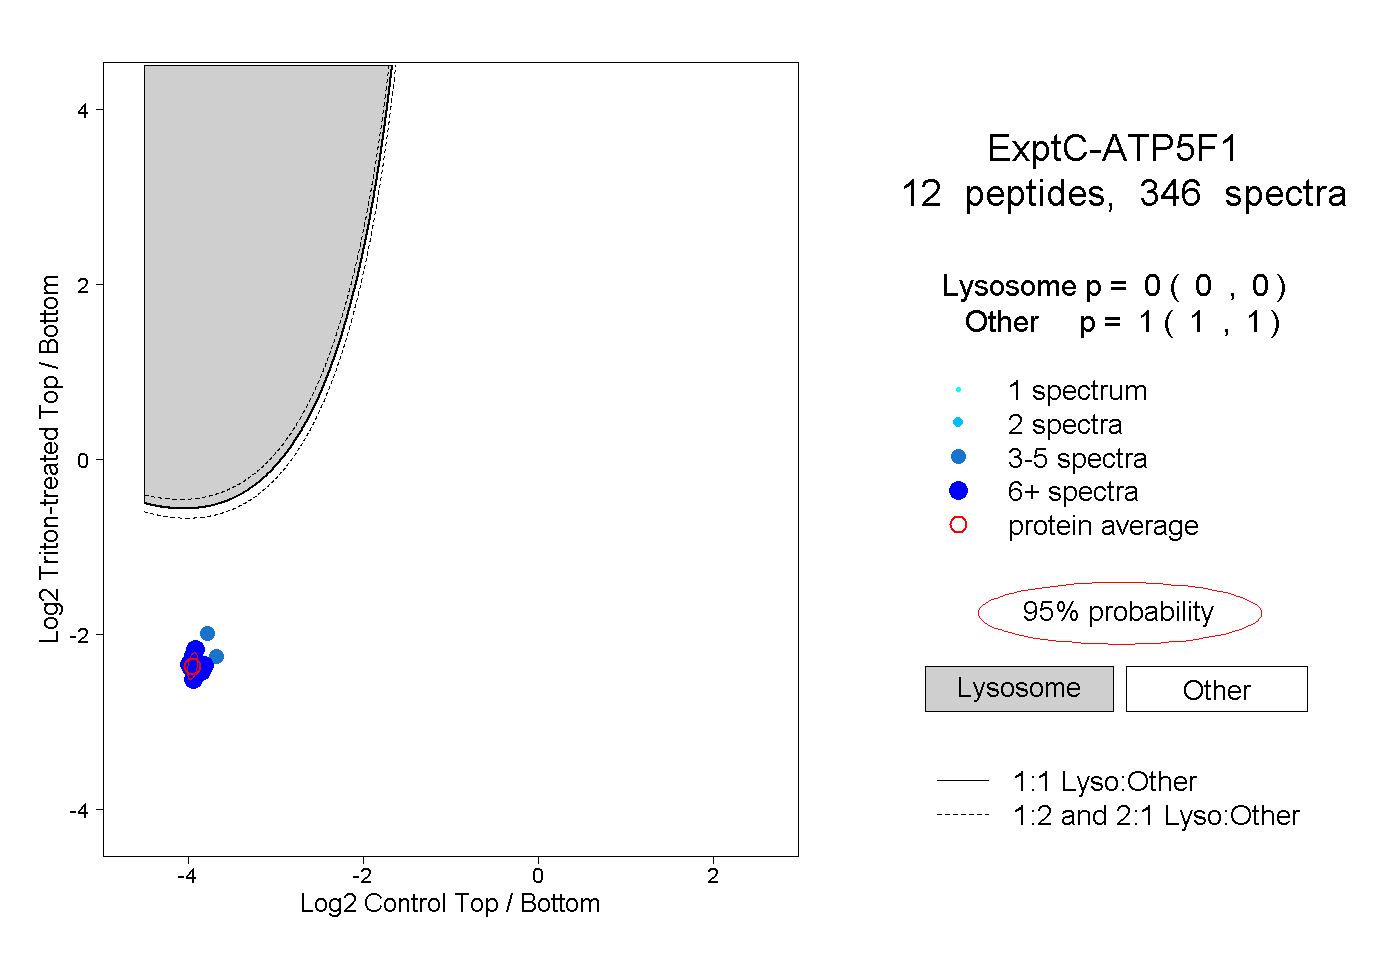 |
0.000 0.000 | 0.000 |
1.000 1.000 | 1.000 |
||||||||
| Plot | Lyso | Other | |||||||||||
| Expt D |
8 peptides |
52 spectra |
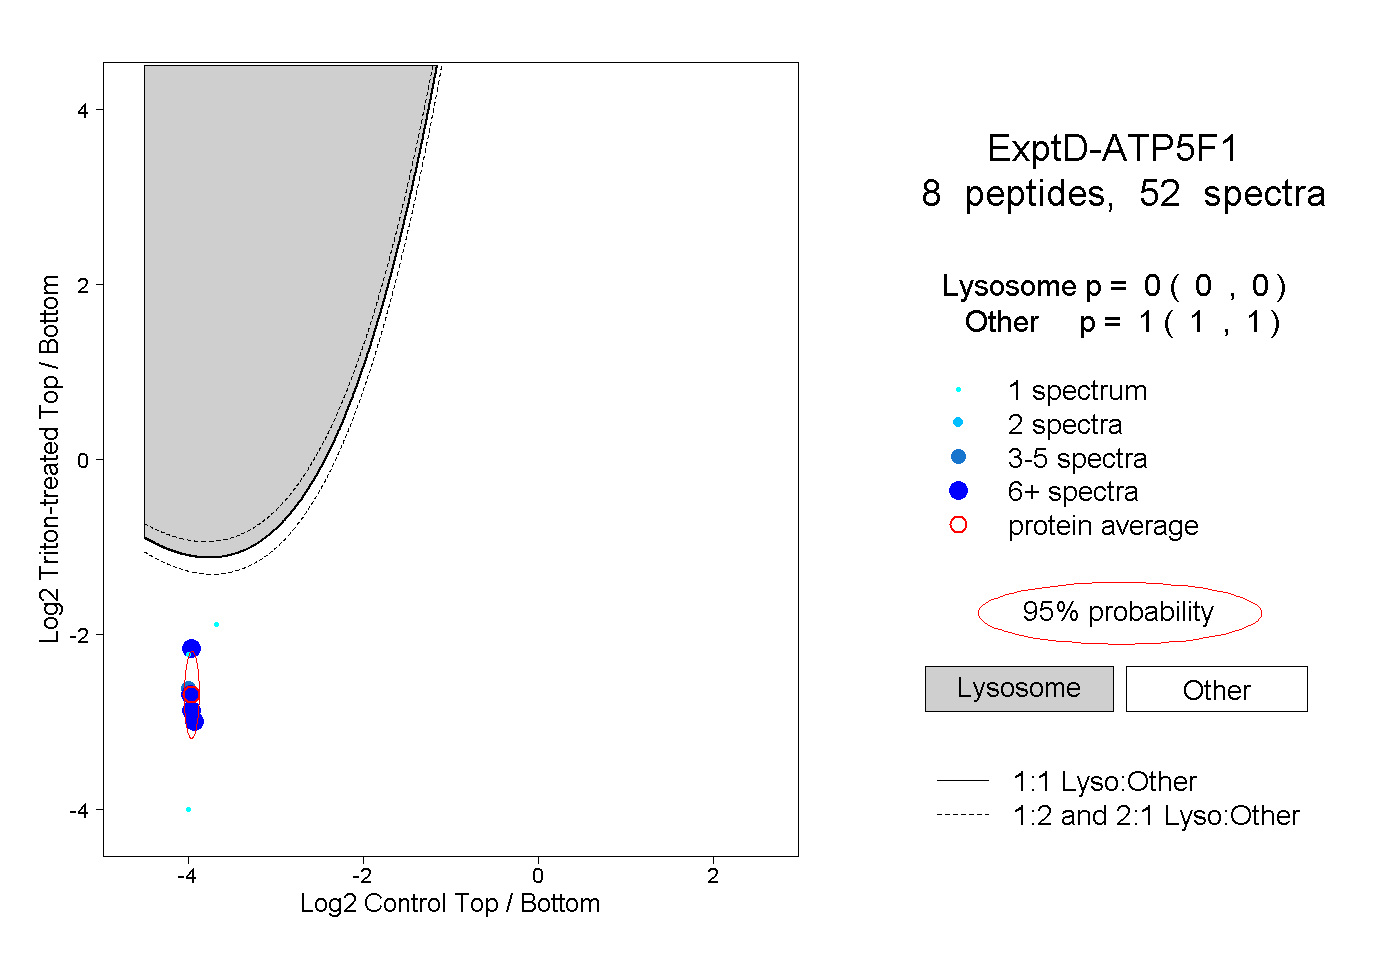 |
0.000 0.000 | 0.000 |
1.000 1.000 | 1.000 |