 2
2peptides
spectra
0.000 | 0.000
0.634 | 0.802
0.000 | 0.113
0.000 | 0.000
0.000 | 0.000
0.121 | 0.258
0.000 | 0.070
0.000 | 0.000
| Plot | Mito | Lyso | Perox | ER | Golgi | PM | Cytosol | Nucleus | |||||
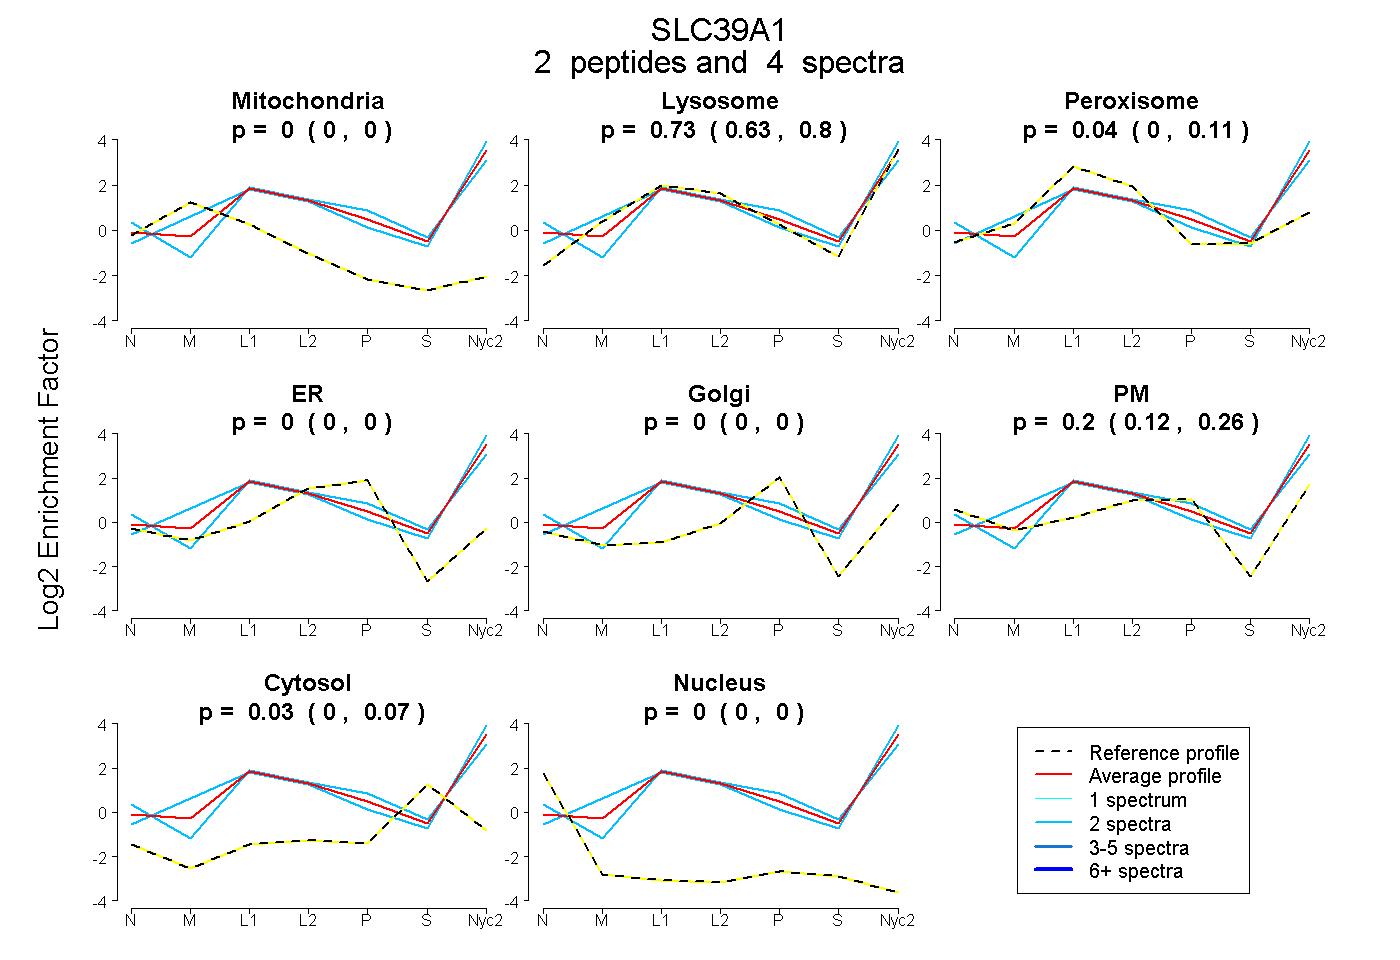
| Expt A |
2 peptides |
4 spectra |
|
0.000 0.000 | 0.000 |
0.734 0.634 | 0.802 |
0.040 0.000 | 0.113 |
0.000 0.000 | 0.000 |
0.000 0.000 | 0.000 |
0.196 0.121 | 0.258 |
0.030 0.000 | 0.070 |
0.000 0.000 | 0.000 |
| 2 spectra, LLQSHLR | 0.000 | 0.929 | 0.000 | 0.000 | 0.000 | 0.071 | 0.000 | 0.000 | ||
| 2 spectra, EQSSPPHPEETR | 0.000 | 0.519 | 0.109 | 0.000 | 0.000 | 0.311 | 0.061 | 0.000 |
| Plot | Mito | Lyso or Perox | ER | Golgi | PM | Cytosol | Nucleus | ||||||
| Expt B |
1 peptide |
2 spectra |
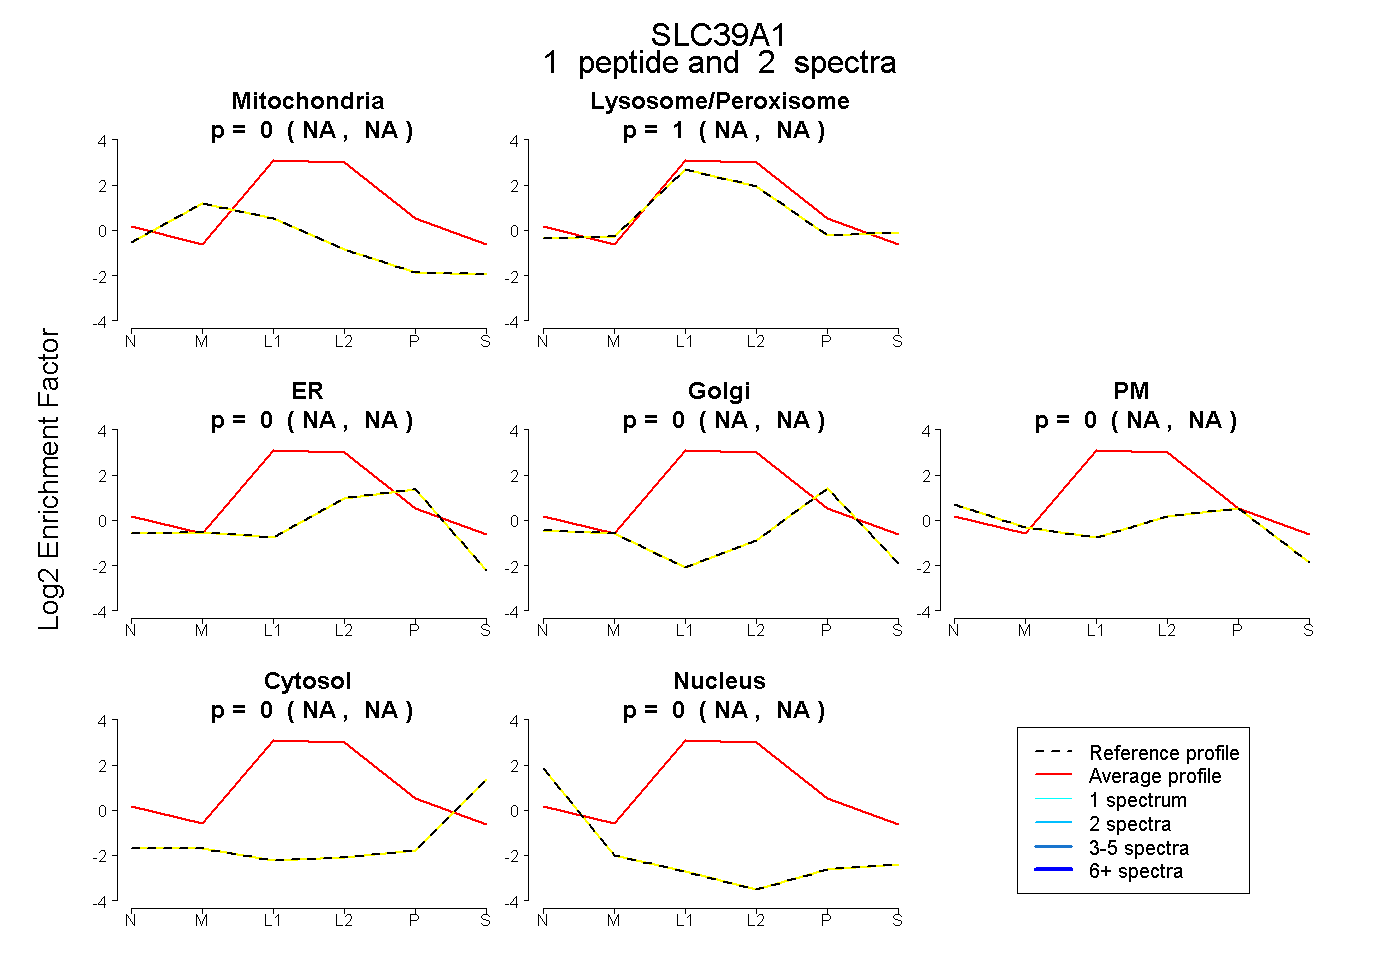 |
0.000 NA | NA |
1.000 NA | NA |
0.000 NA | NA |
0.000 NA | NA |
0.000 NA | NA |
0.000 NA | NA |
0.000 NA | NA |
|||
| Plot | Lyso | Other | |||||||||||
| Expt C |
3 peptides |
19 spectra |
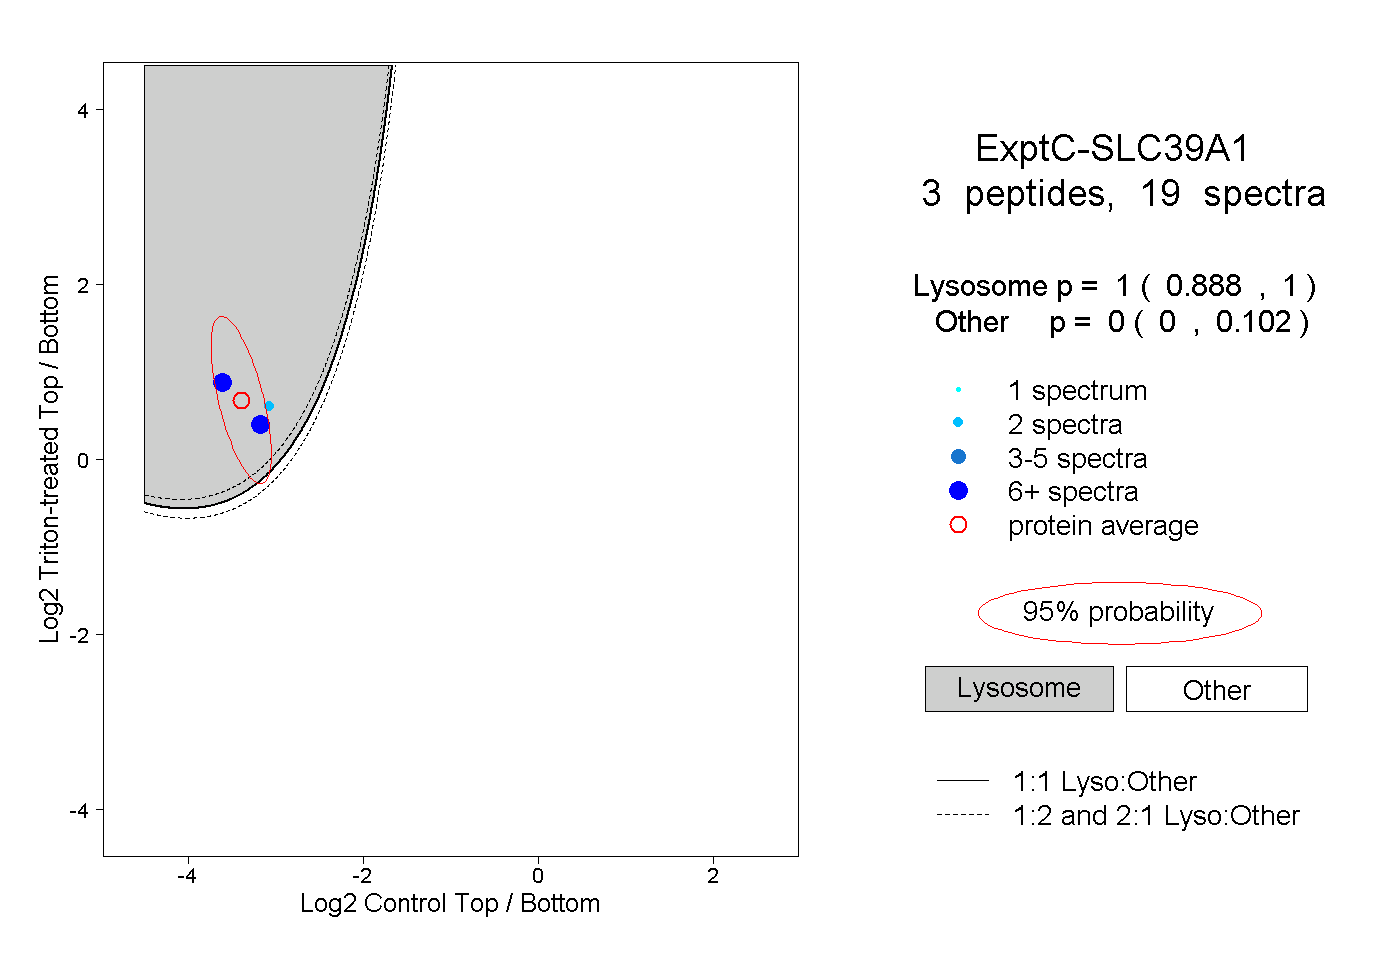 |
1.000 0.888 | 1.000 |
0.000 0.000 | 0.102 |
||||||||
| Plot | Lyso | Other | |||||||||||
| Expt D |
2 peptides |
3 spectra |
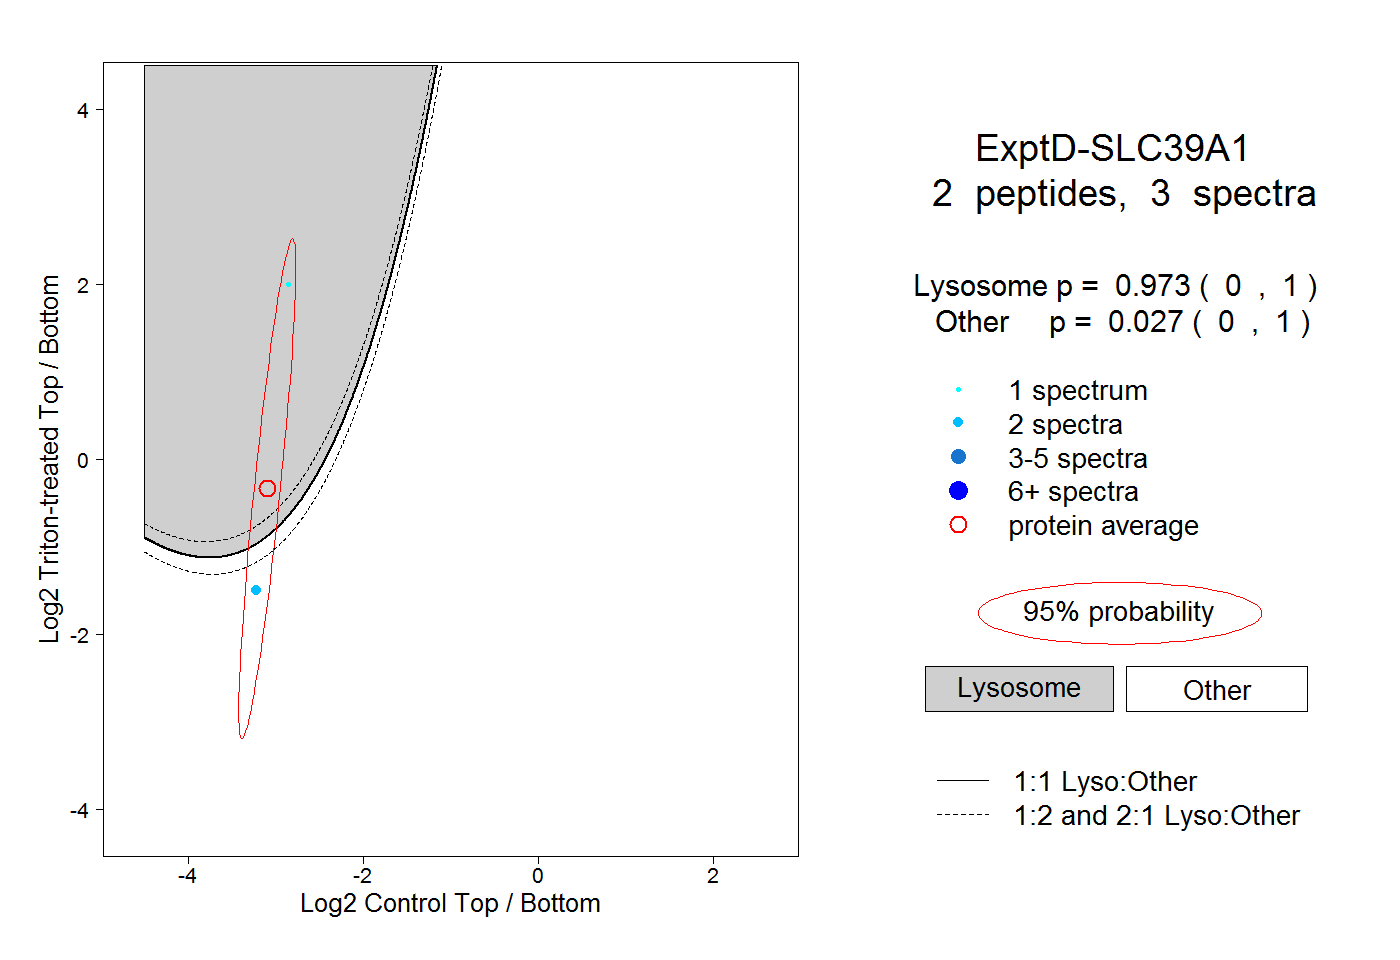 |
0.973 0.000 | 1.000 |
0.027 0.000 | 1.000 |