8
8peptides
spectra
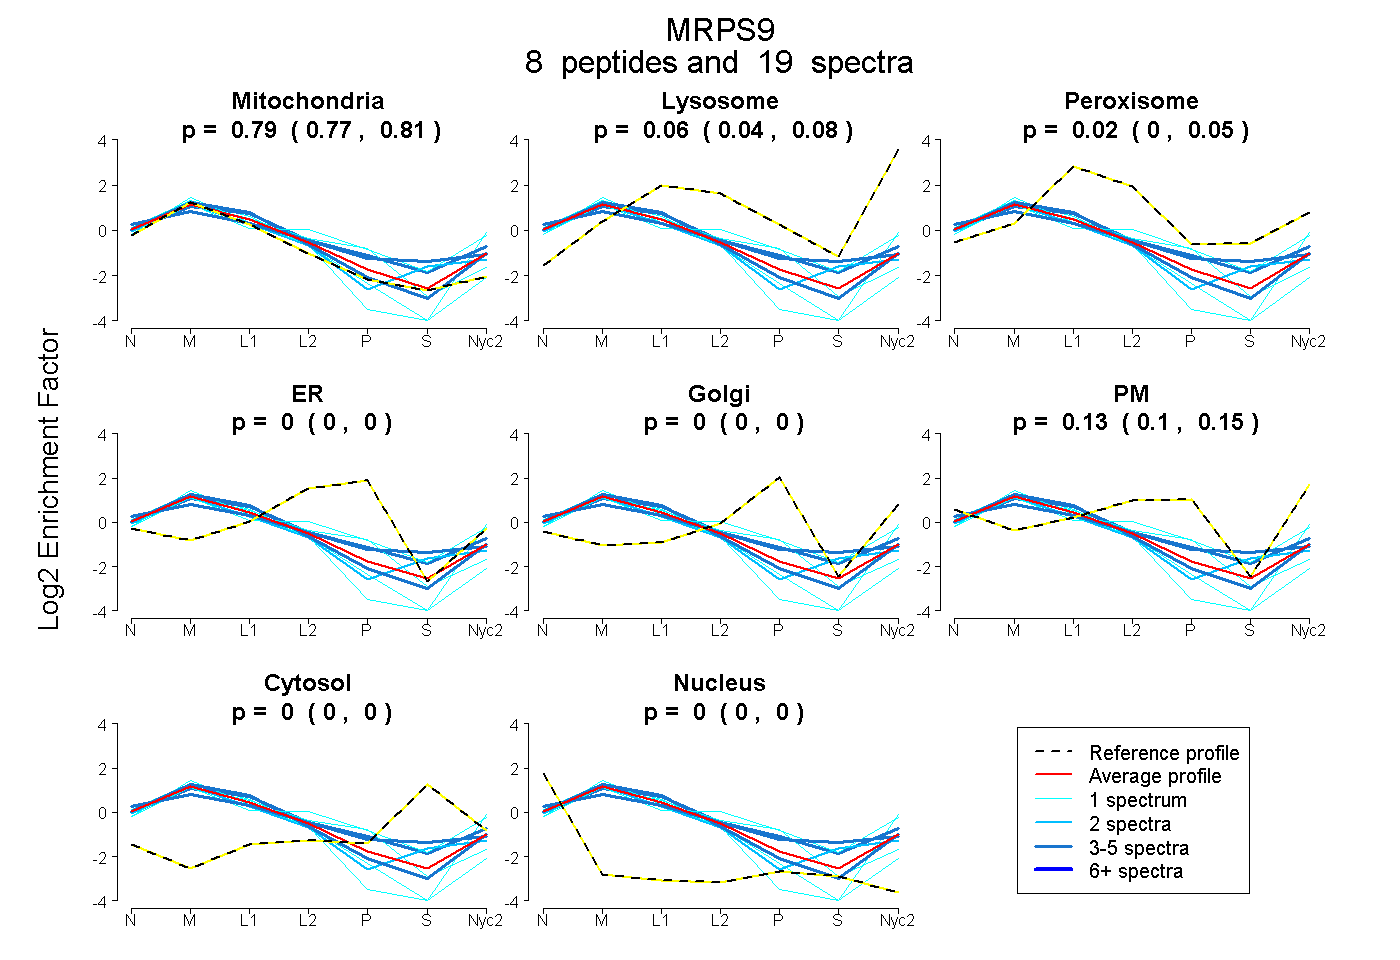
0.773 | 0.805
0.040 | 0.080
0.000 | 0.048
0.000 | 0.000
0.000 | 0.000
0.098 | 0.150
0.000 | 0.000
0.000 | 0.000
2peptides
spectra
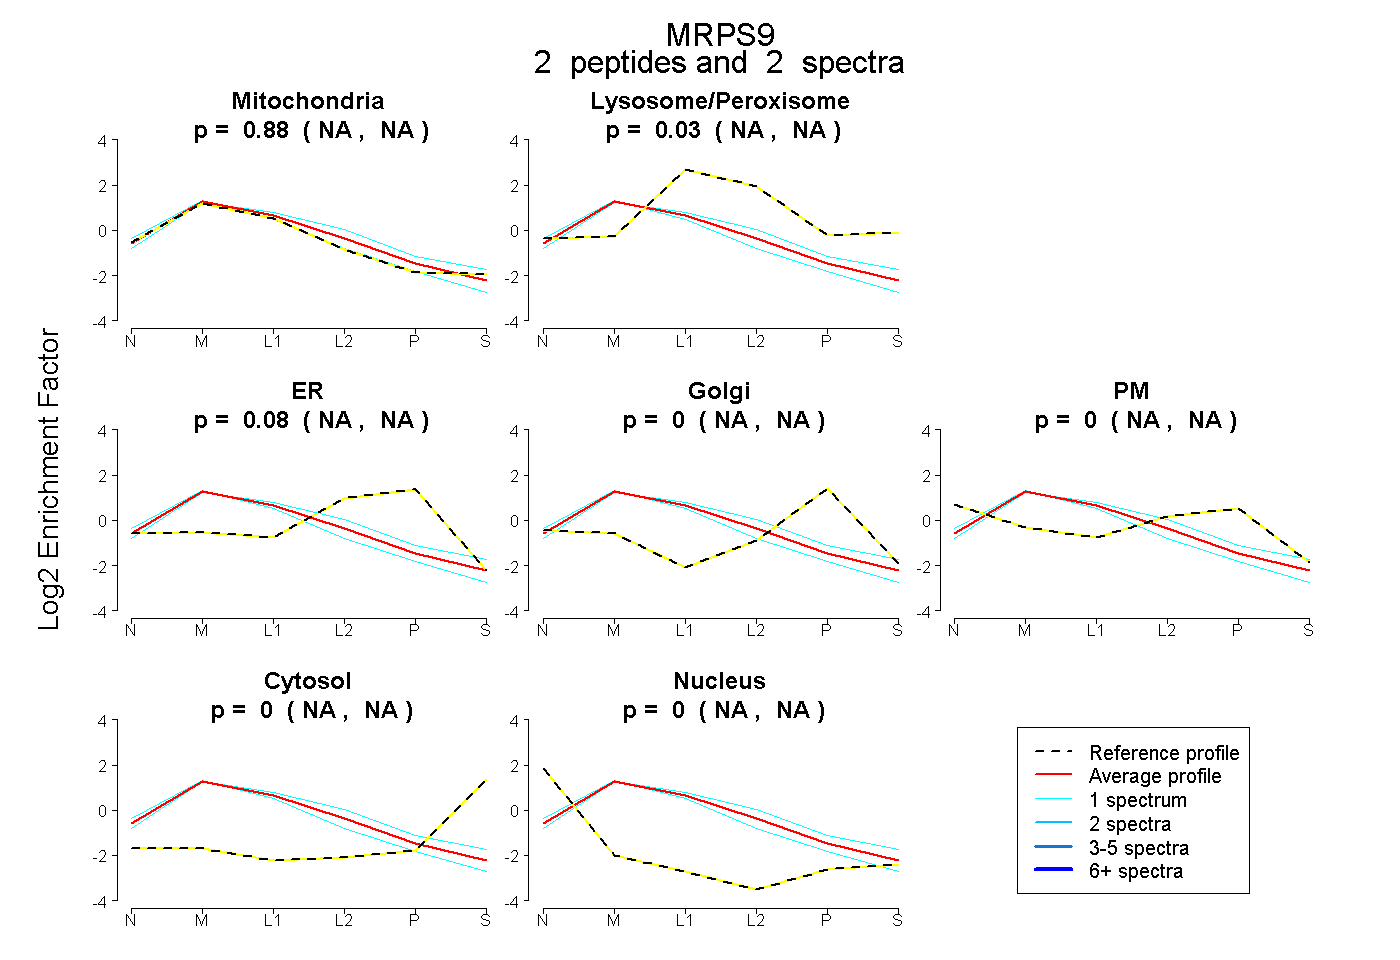
NA | NA
NA | NA
NA | NA
NA | NA
NA | NA
NA | NA
NA | NA
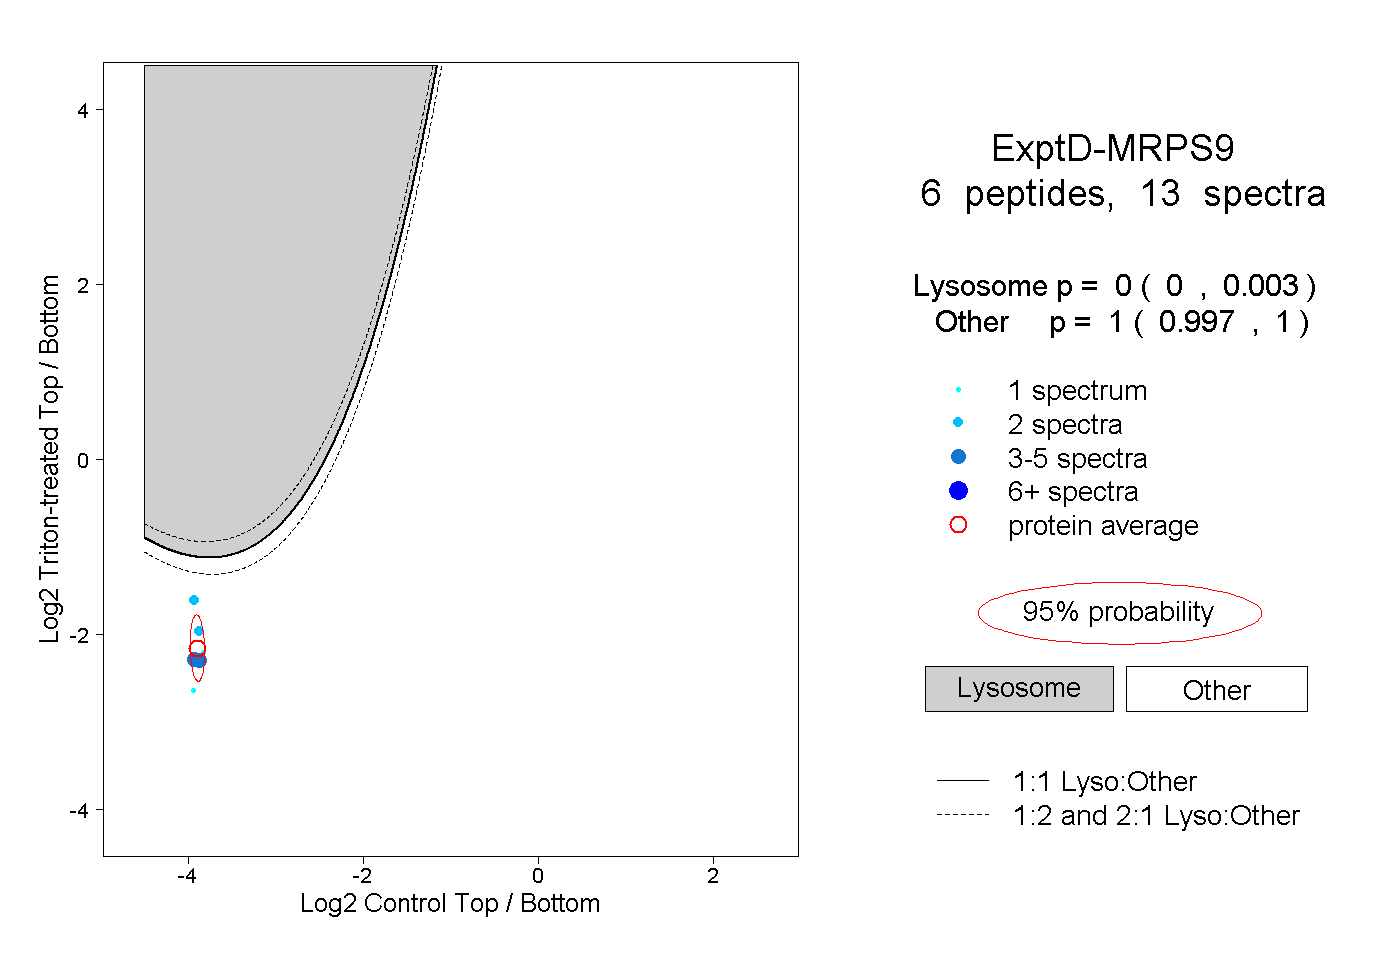
17peptides
spectra
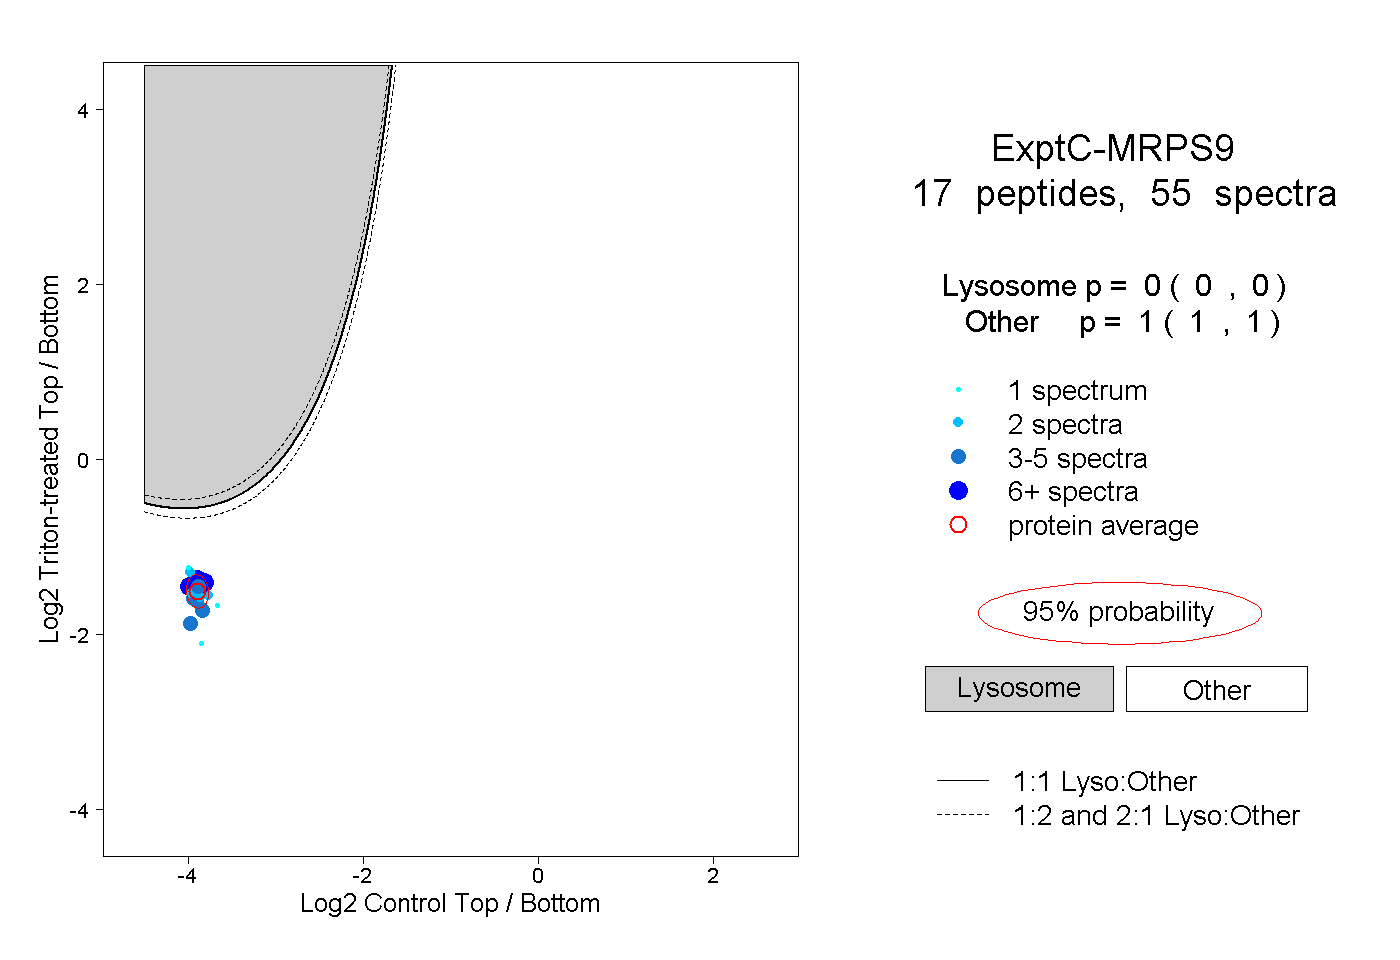
0.000 | 0.000
1.000 | 1.000