 8
8peptides
spectra
0.773 | 0.805
0.040 | 0.080
0.000 | 0.048
0.000 | 0.000
0.000 | 0.000
0.098 | 0.150
0.000 | 0.000
0.000 | 0.000
| Plot | Mito | Lyso | Perox | ER | Golgi | PM | Cytosol | Nucleus | |||||
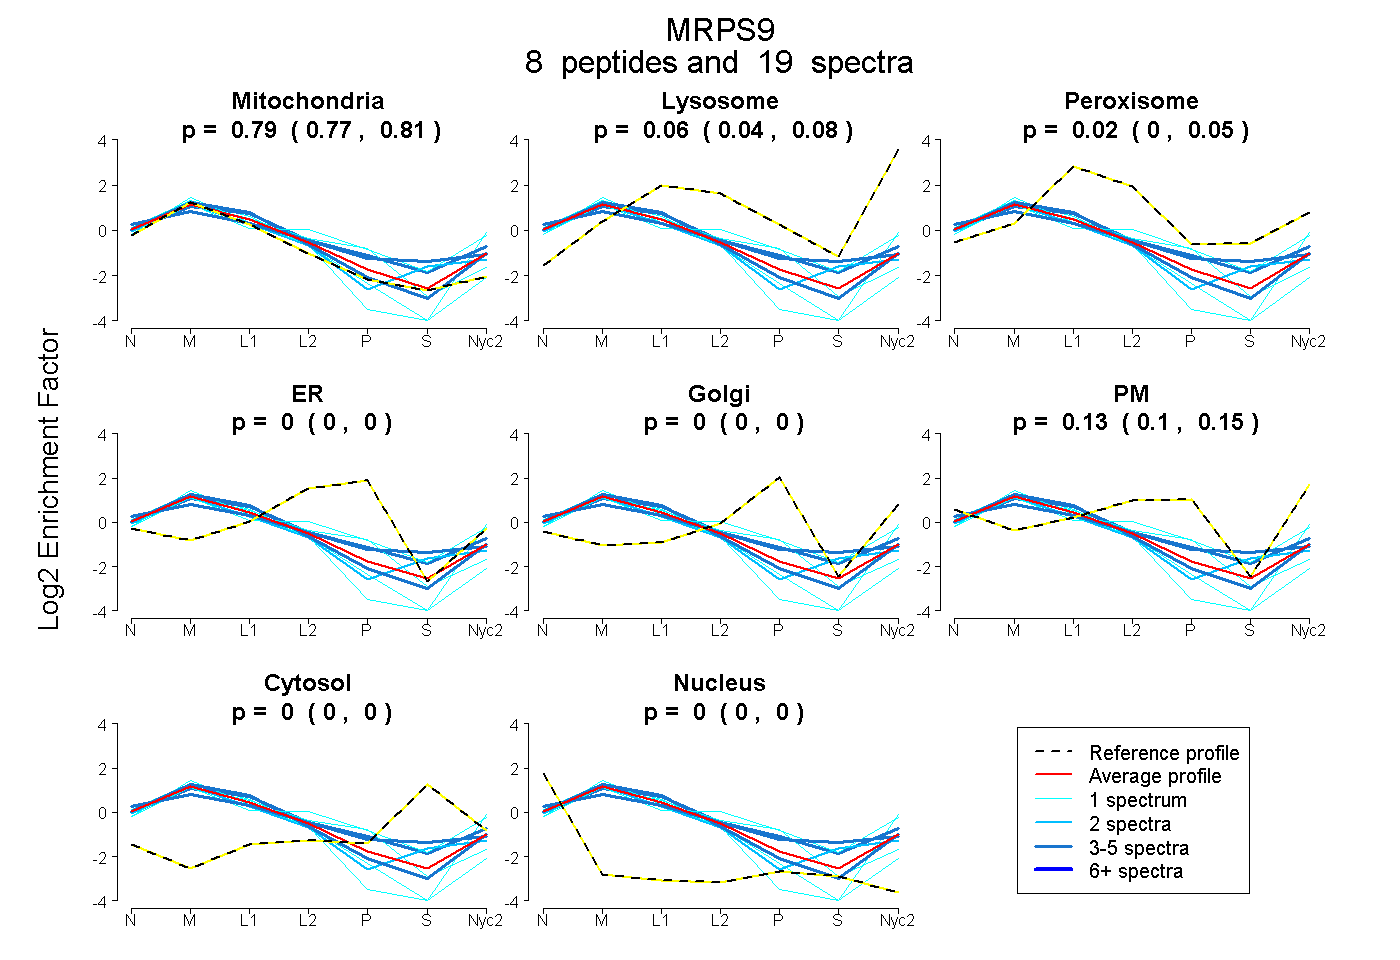
| Expt A |
8 peptides |
19 spectra |
|
0.791 0.773 | 0.805 |
0.061 0.040 | 0.080 |
0.023 0.000 | 0.048 |
0.000 0.000 | 0.000 |
0.000 0.000 | 0.000 |
0.126 0.098 | 0.150 |
0.000 0.000 | 0.000 |
0.000 0.000 | 0.000 |
| 5 spectra, LSDQDYTQFIR | 0.851 | 0.106 | 0.000 | 0.000 | 0.000 | 0.043 | 0.000 | 0.000 | ||
| 3 spectra, GPLSENTESR | 0.634 | 0.041 | 0.150 | 0.000 | 0.000 | 0.157 | 0.018 | 0.000 | ||
| 2 spectra, HPEQIFPK | 0.787 | 0.000 | 0.121 | 0.000 | 0.000 | 0.000 | 0.091 | 0.000 | ||
| 1 spectrum, EQLMFPFHFLDR | 0.778 | 0.096 | 0.000 | 0.000 | 0.000 | 0.126 | 0.000 | 0.000 | ||
| 1 spectrum, HDVTCTVSGGGR | 0.730 | 0.000 | 0.000 | 0.266 | 0.000 | 0.004 | 0.000 | 0.000 | ||
| 1 spectrum, QAGLLTPDPR | 0.557 | 0.160 | 0.000 | 0.000 | 0.000 | 0.239 | 0.043 | 0.000 | ||
| 1 spectrum, LLTLPCGPAEEDFVQR | 1.000 | 0.000 | 0.000 | 0.000 | 0.000 | 0.000 | 0.000 | 0.000 | ||
| 5 spectra, SAQAGAIR | 0.597 | 0.000 | 0.147 | 0.000 | 0.000 | 0.132 | 0.116 | 0.007 |
| Plot | Mito | Lyso or Perox | ER | Golgi | PM | Cytosol | Nucleus | ||||||
| Expt B |
2 peptides |
2 spectra |
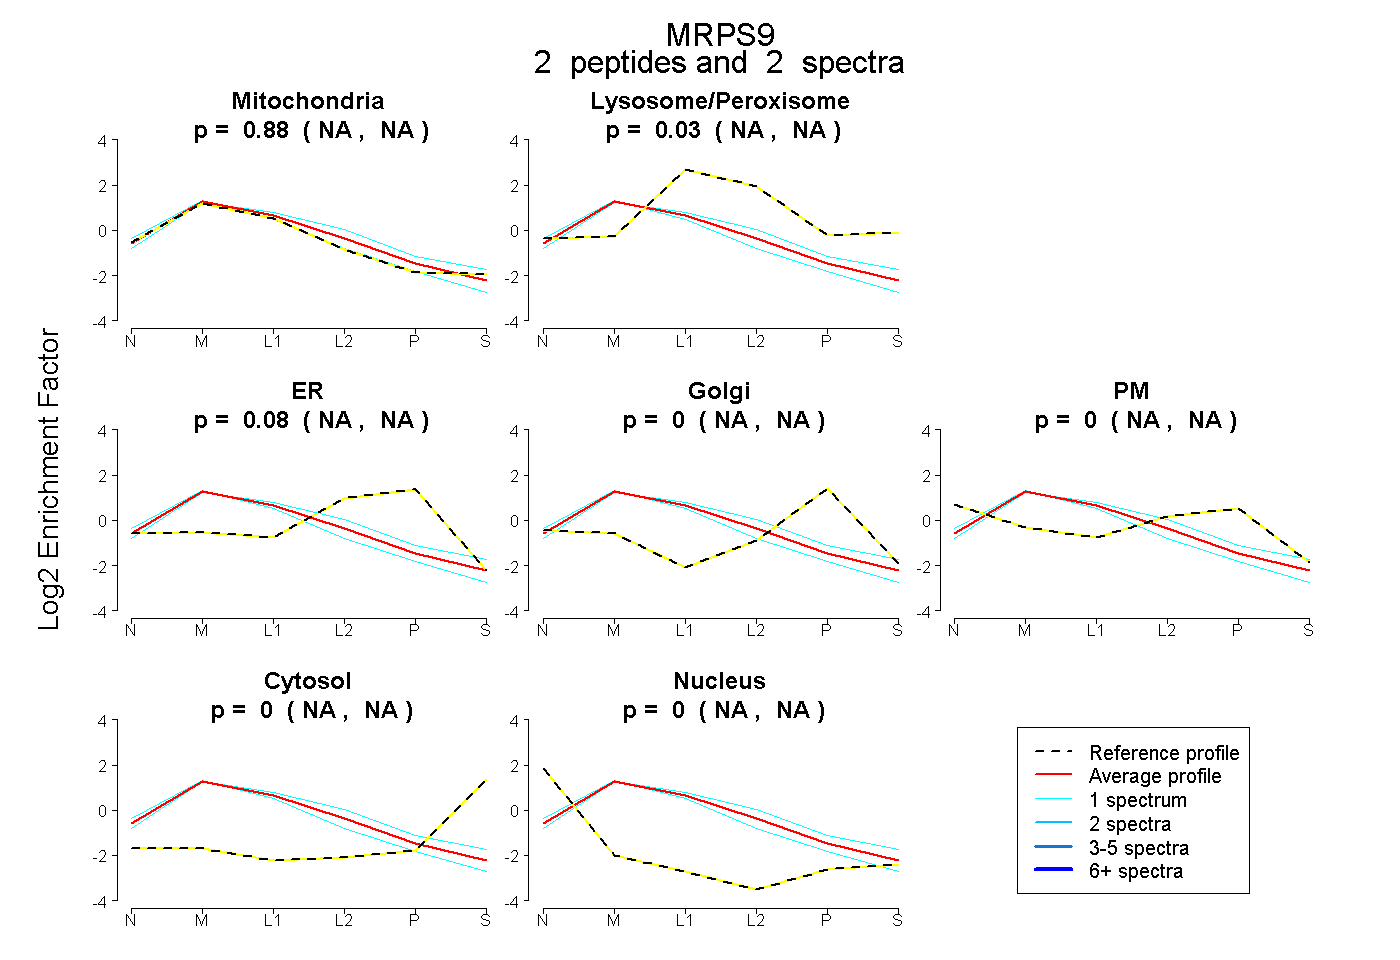 |
0.885 NA | NA |
0.034 NA | NA |
0.081 NA | NA |
0.000 NA | NA |
0.000 NA | NA |
0.000 NA | NA |
0.000 NA | NA |
|||
| Plot | Lyso | Other | |||||||||||
| Expt C |
17 peptides |
55 spectra |
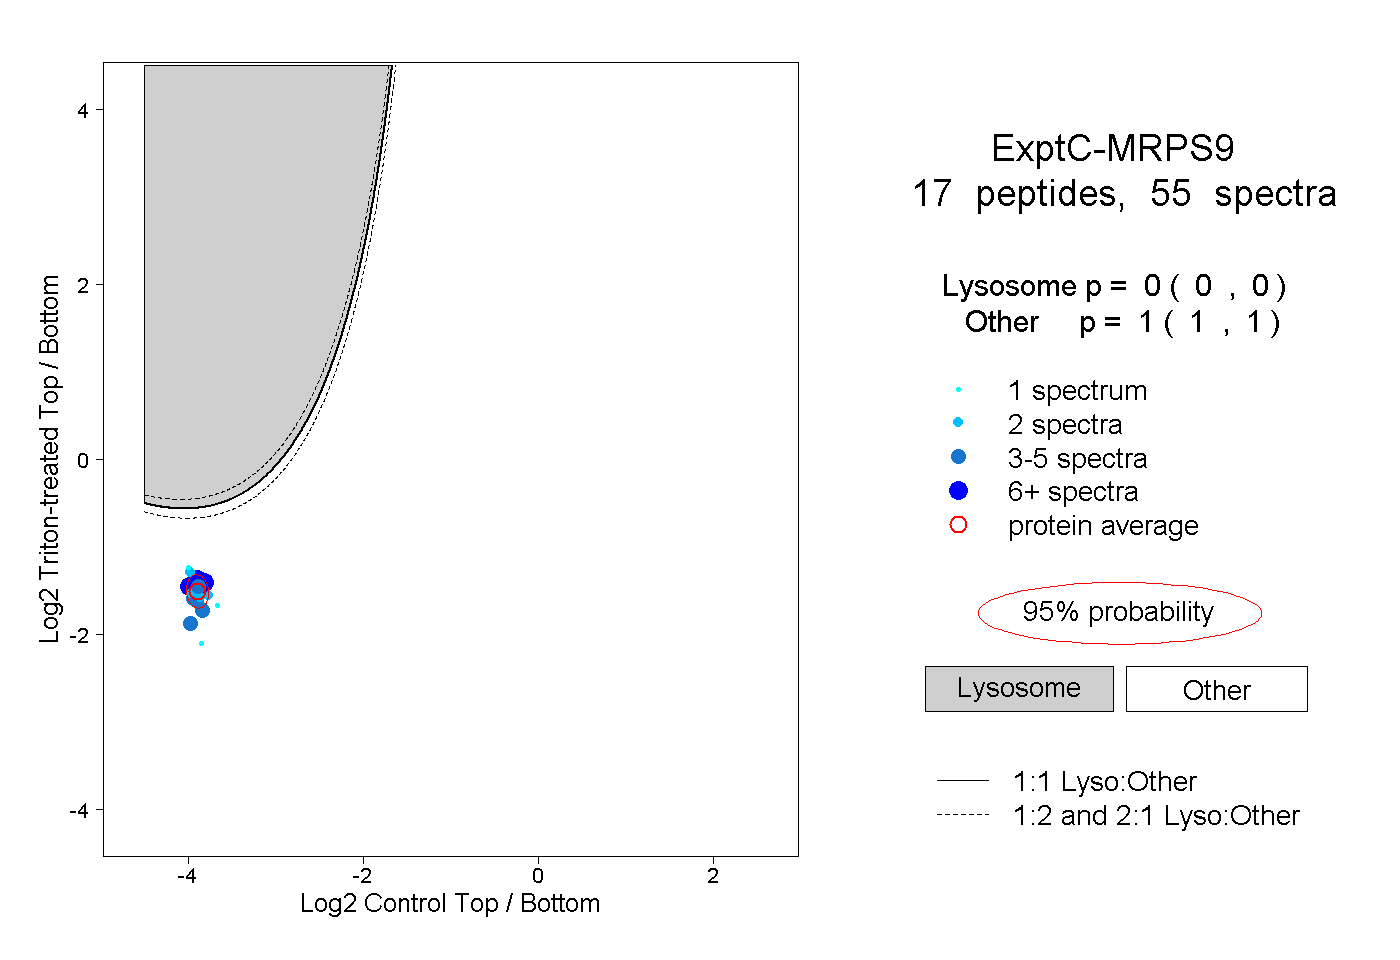 |
0.000 0.000 | 0.000 |
1.000 1.000 | 1.000 |
||||||||
| Plot | Lyso | Other | |||||||||||
| Expt D |
6 peptides |
13 spectra |
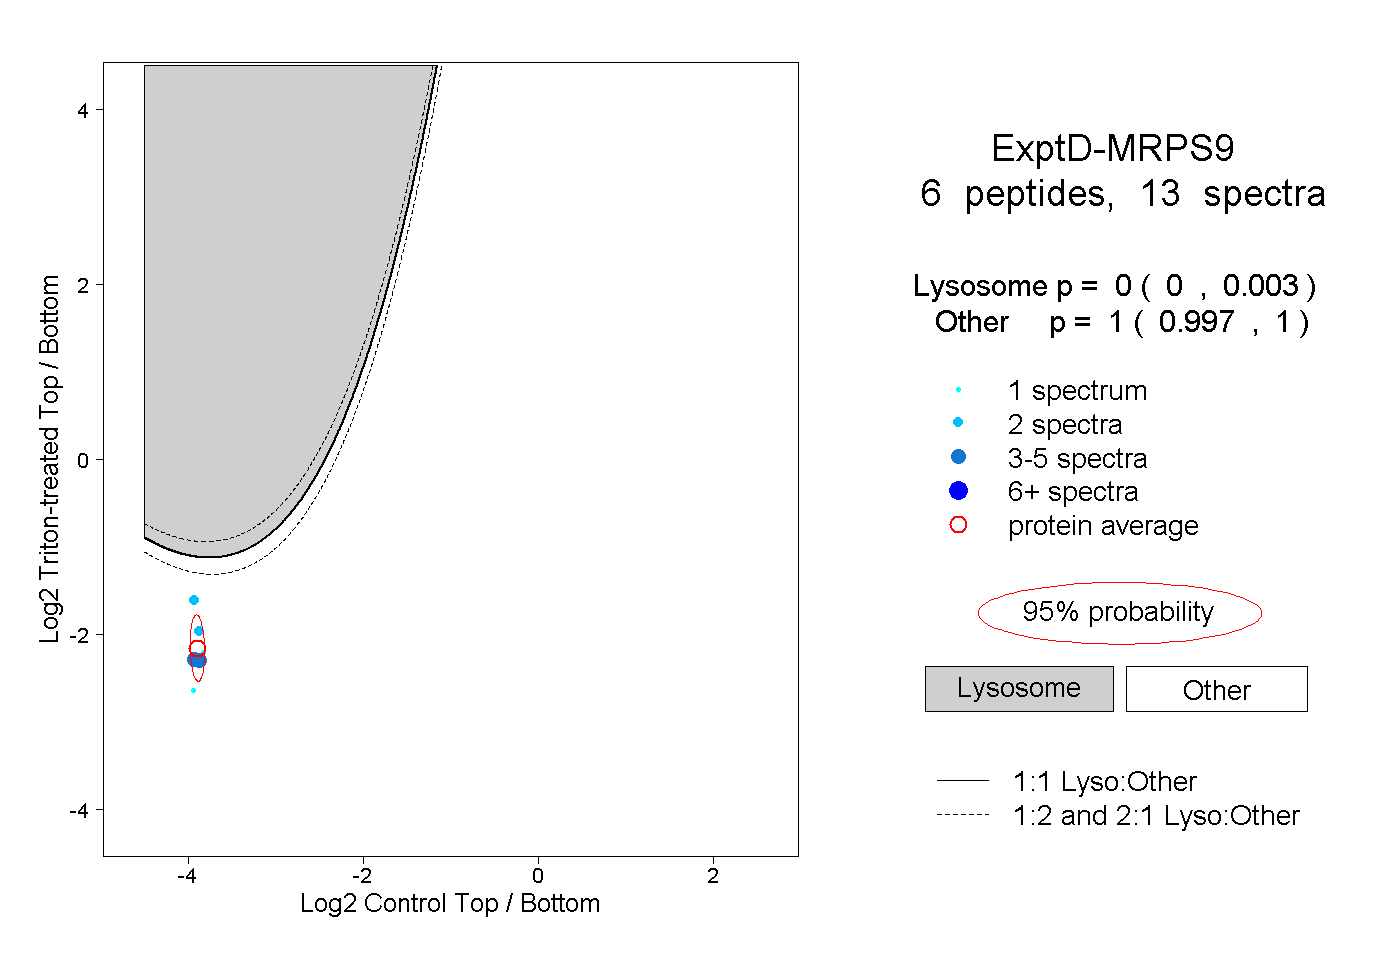 |
0.000 0.000 | 0.003 |
1.000 0.997 | 1.000 |