 3
3peptides
spectra
0.000 | 0.000
0.457 | 0.543
0.000 | 0.000
0.000 | 0.003
0.161 | 0.240
0.000 | 0.034
0.249 | 0.309
0.000 | 0.000
4peptides
spectra
0.000 | 0.123
0.876 | 1.000
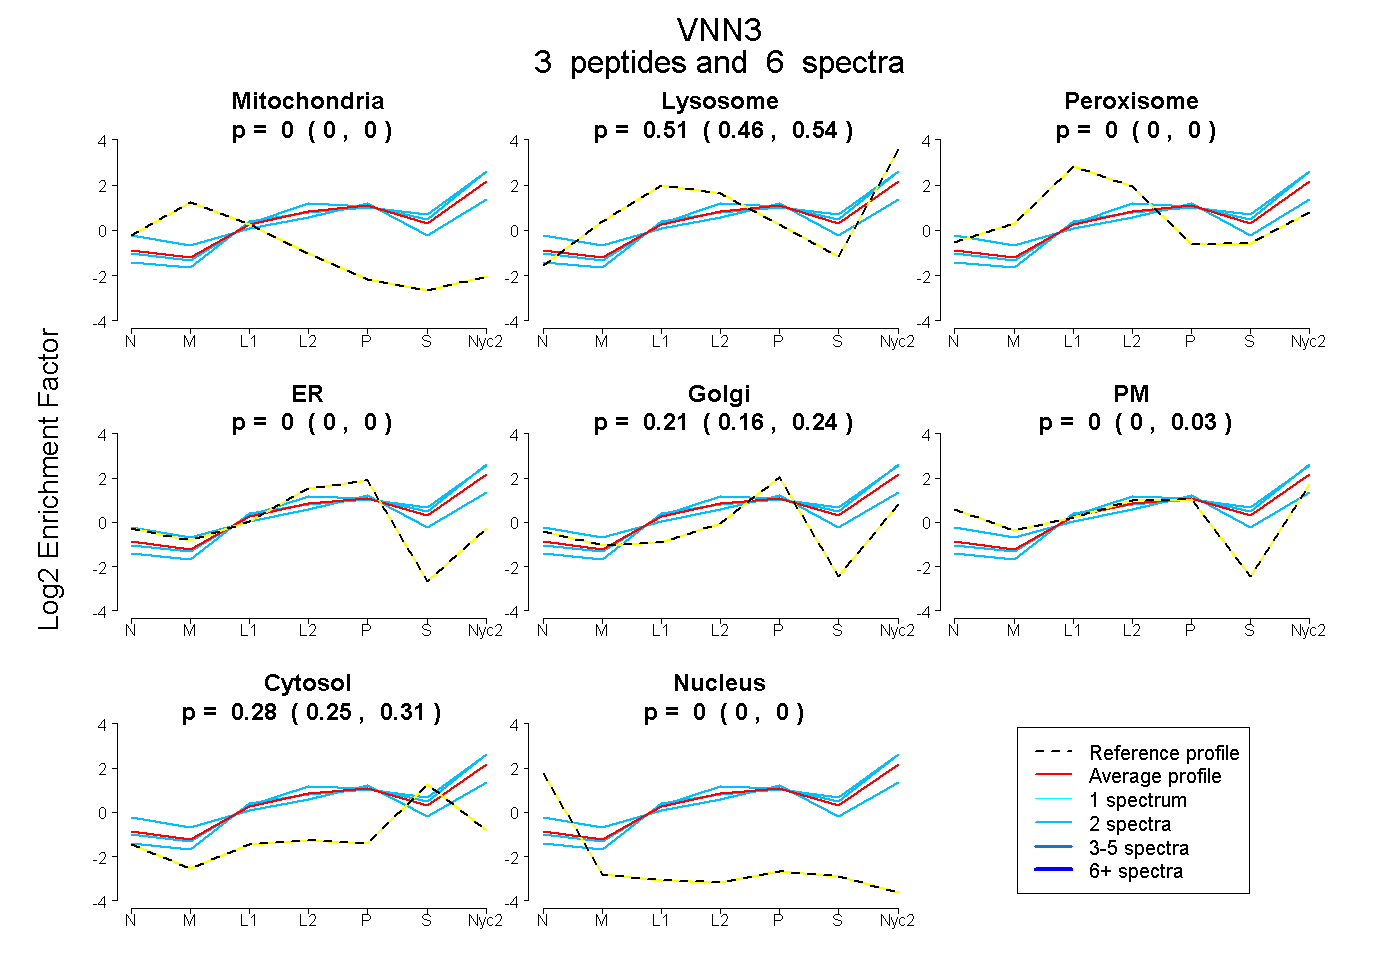
| Plot | Mito | Lyso | Perox | ER | Golgi | PM | Cytosol | Nucleus | |||||
| Expt A |
3 peptides |
6 spectra |
|
0.000 0.000 | 0.000 |
0.509 0.457 | 0.543 |
0.000 0.000 | 0.000 |
0.000 0.000 | 0.003 |
0.210 0.161 | 0.240 |
0.000 0.000 | 0.034 |
0.281 0.249 | 0.309 |
0.000 0.000 | 0.000 |
||
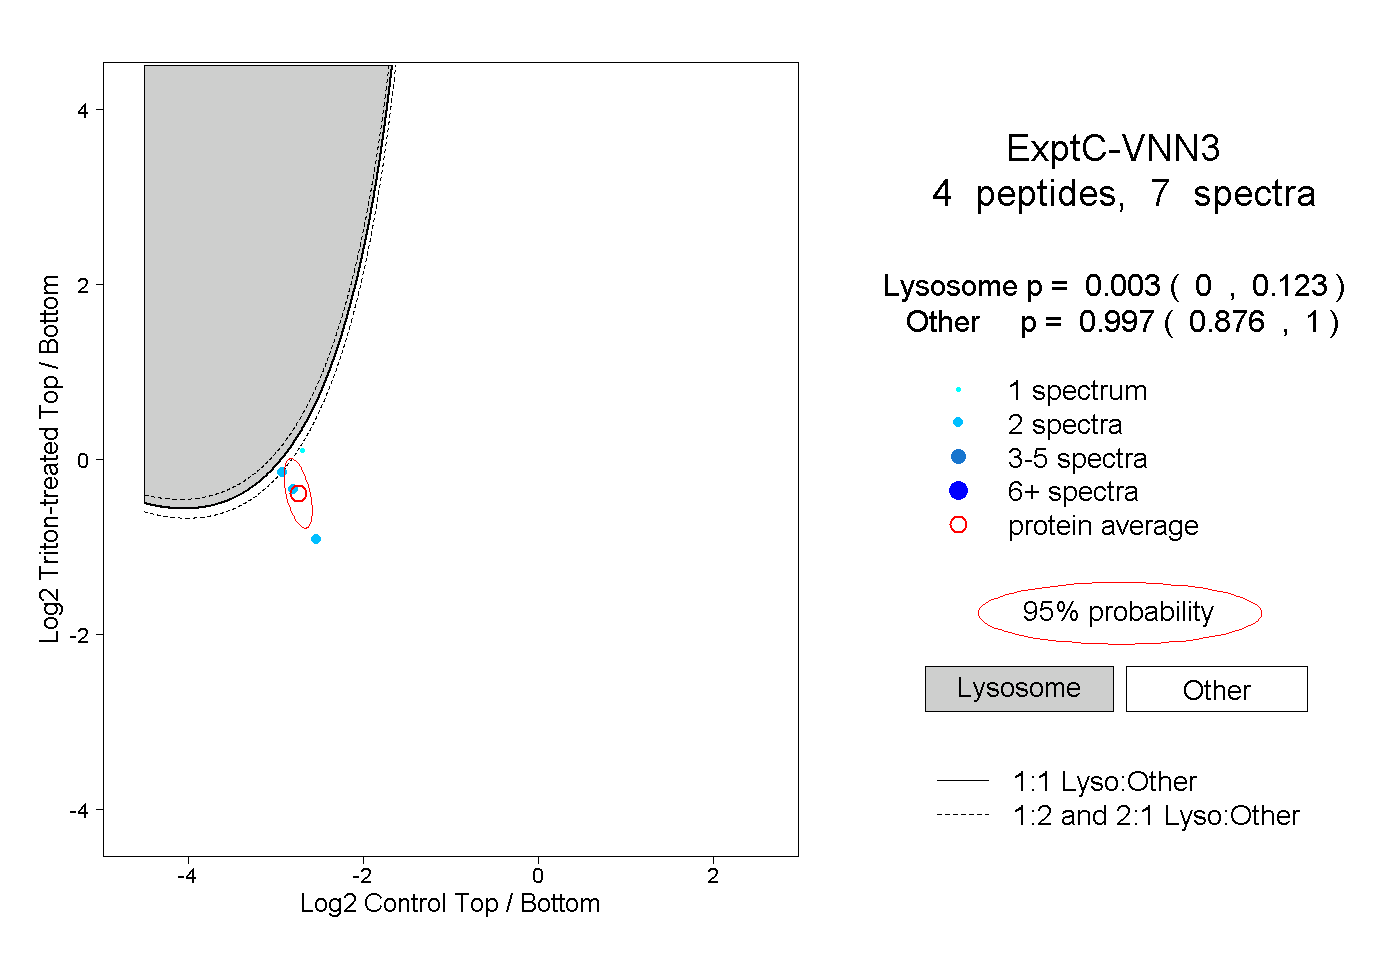
| Plot | Lyso | Other | |||||||||||
| Expt C |
4 peptides |
7 spectra |
|
0.003 0.000 | 0.123 |
0.997 0.876 | 1.000 |
| 2 spectra, YQYNTNVVFDSEGR | 0.178 | 0.822 | ||||||||
| 2 spectra, TCGEPVGSAFTK | 0.000 | 1.000 | ||||||||
| 2 spectra, YYEVSR | 0.009 | 0.991 | ||||||||
| 1 spectrum, NIDILENAIK | 0.111 | 0.889 |