 4
4peptides
spectra
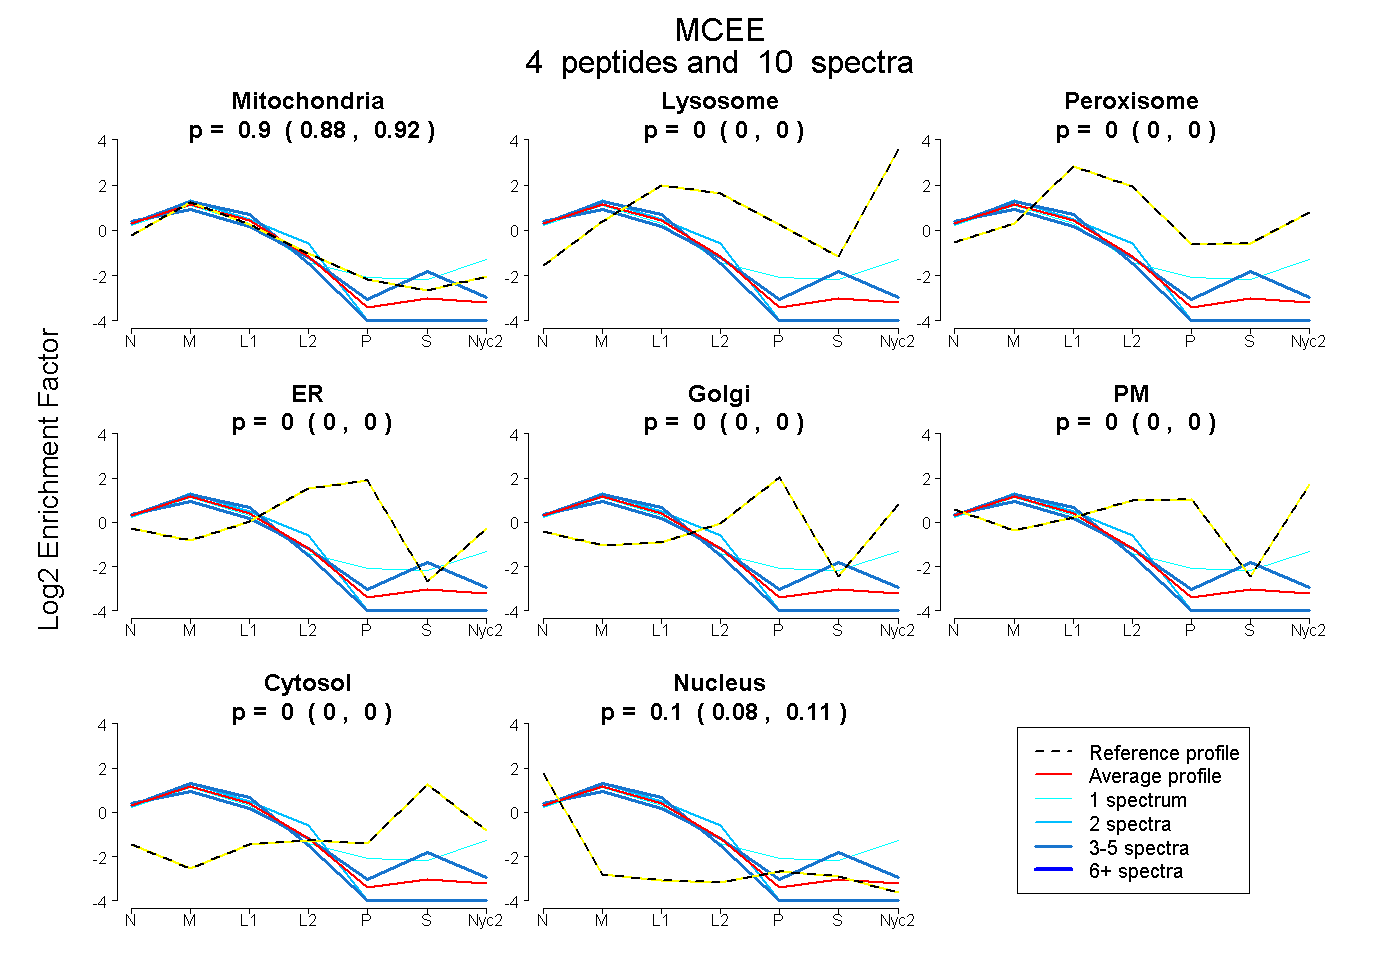
0.884 | 0.916
0.000 | 0.000
0.000 | 0.000
0.000 | 0.000
0.000 | 0.000
0.000 | 0.000
0.000 | 0.000
0.080 | 0.113
2peptides
spectra
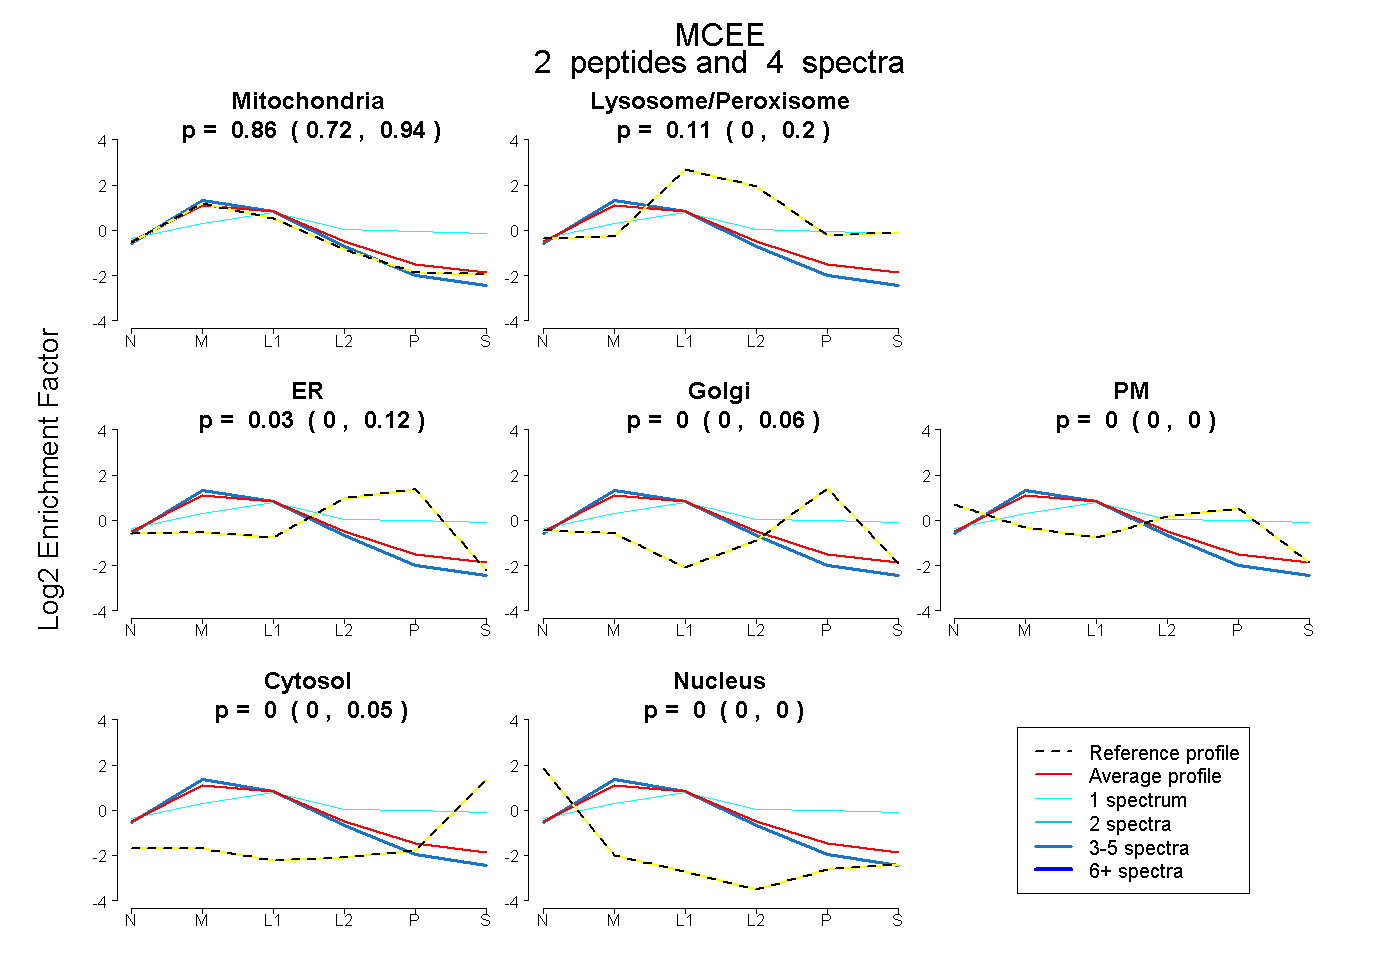
0.721 | 0.940
0.000 | 0.197
0.000 | 0.120
0.000 | 0.055
0.000 | 0.000
0.000 | 0.049
0.000 | 0.002
4peptides
spectra
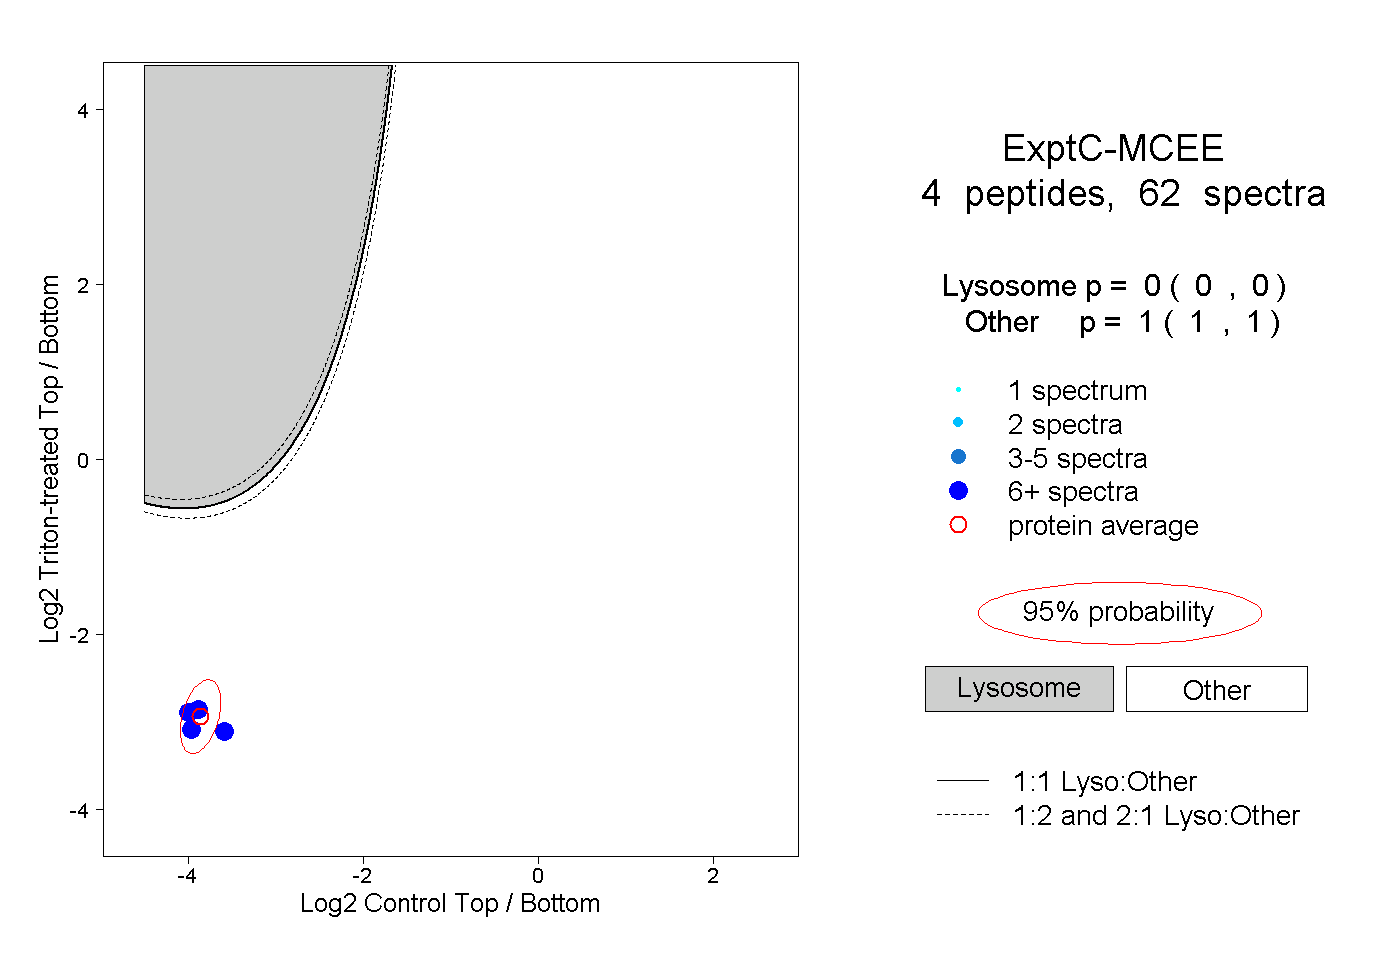
0.000 | 0.000
1.000 | 1.000
2peptides
spectra
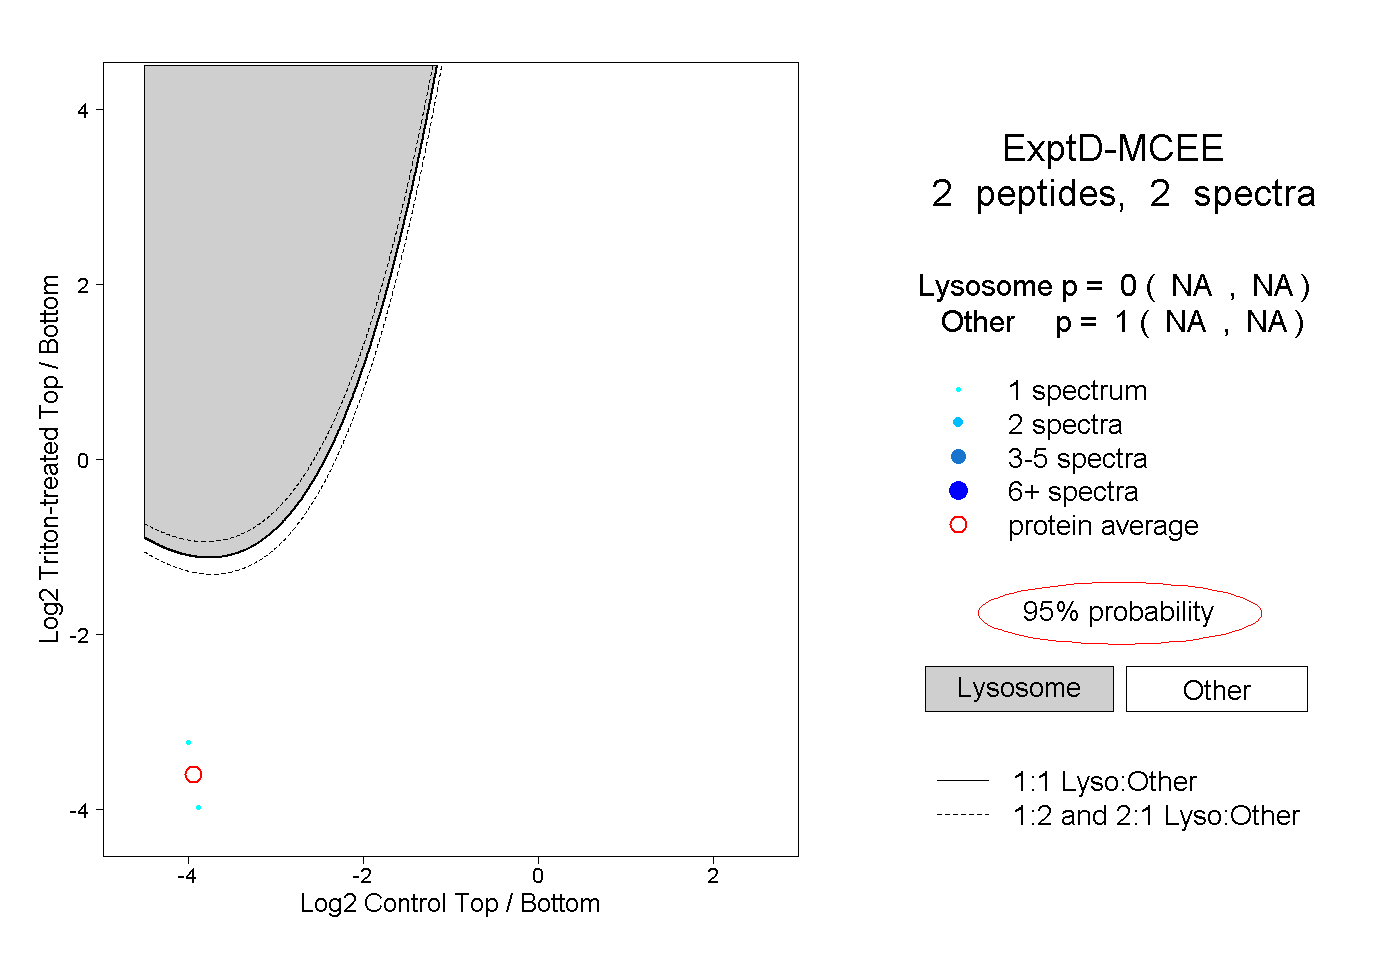
NA | NA
NA | NA