20
20peptides
spectra
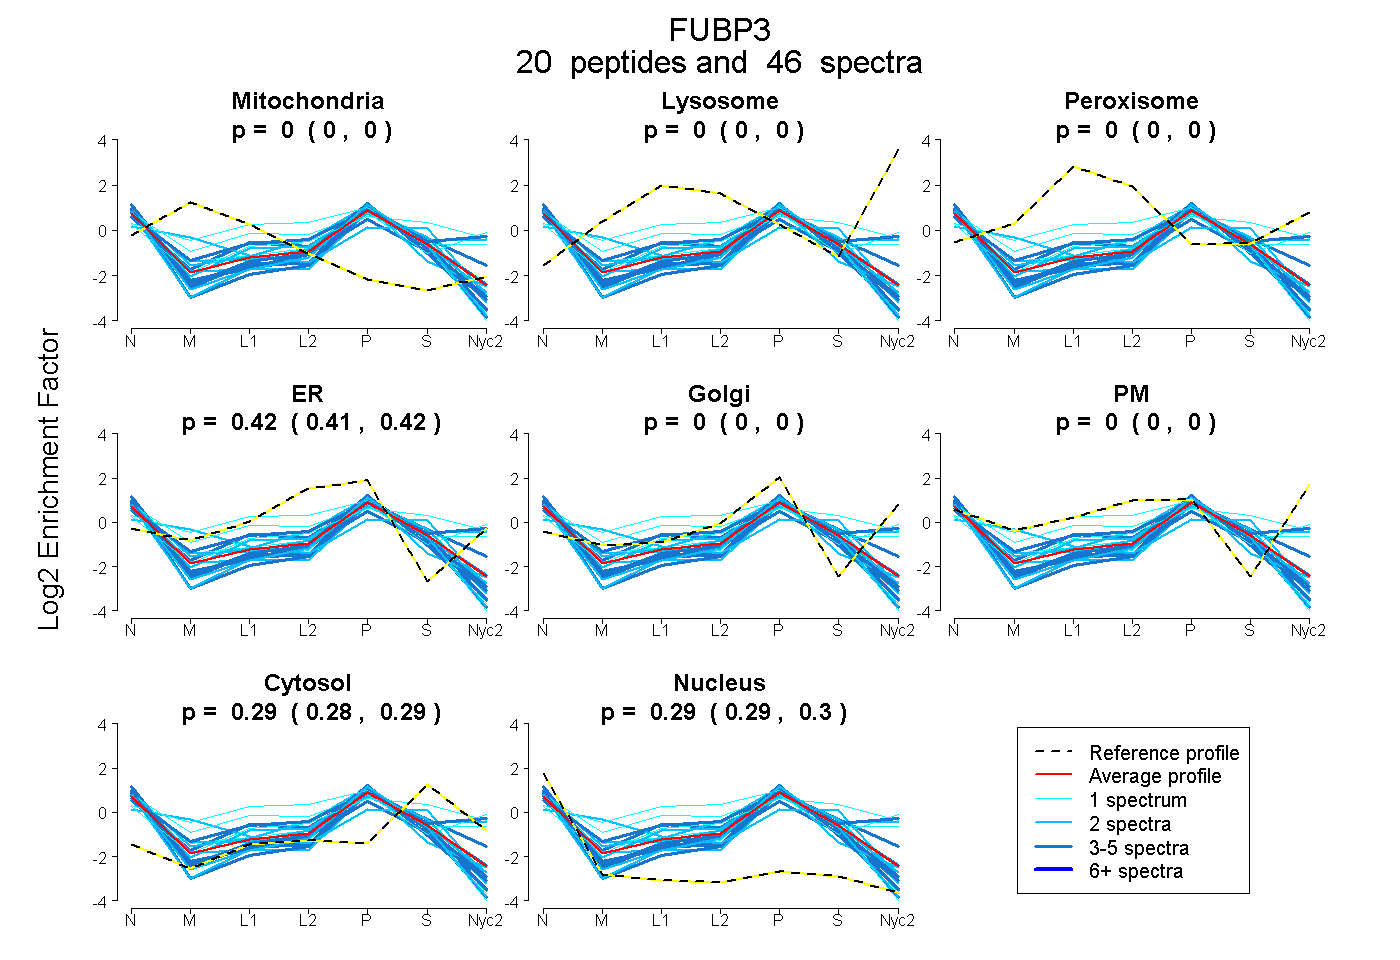
0.000 | 0.000
0.000 | 0.000
0.000 | 0.000
0.411 | 0.420
0.000 | 0.000
0.000 | 0.000
0.284 | 0.295
0.288 | 0.300
9peptides
spectra
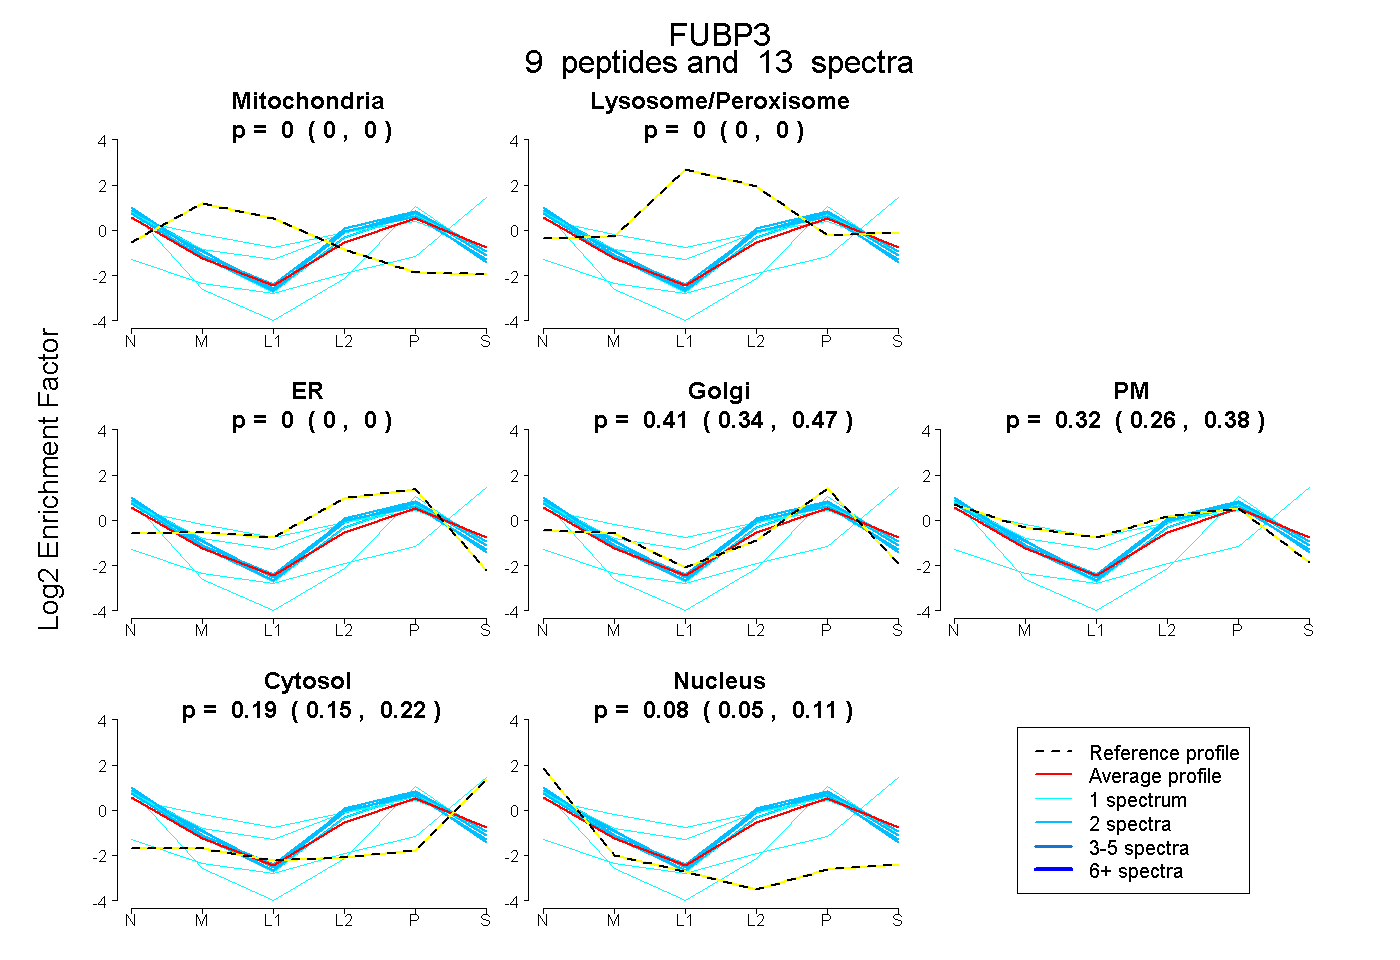
0.000 | 0.000
0.000 | 0.000
0.000 | 0.000
0.343 | 0.467
0.255 | 0.376
0.153 | 0.216
0.051 | 0.106